

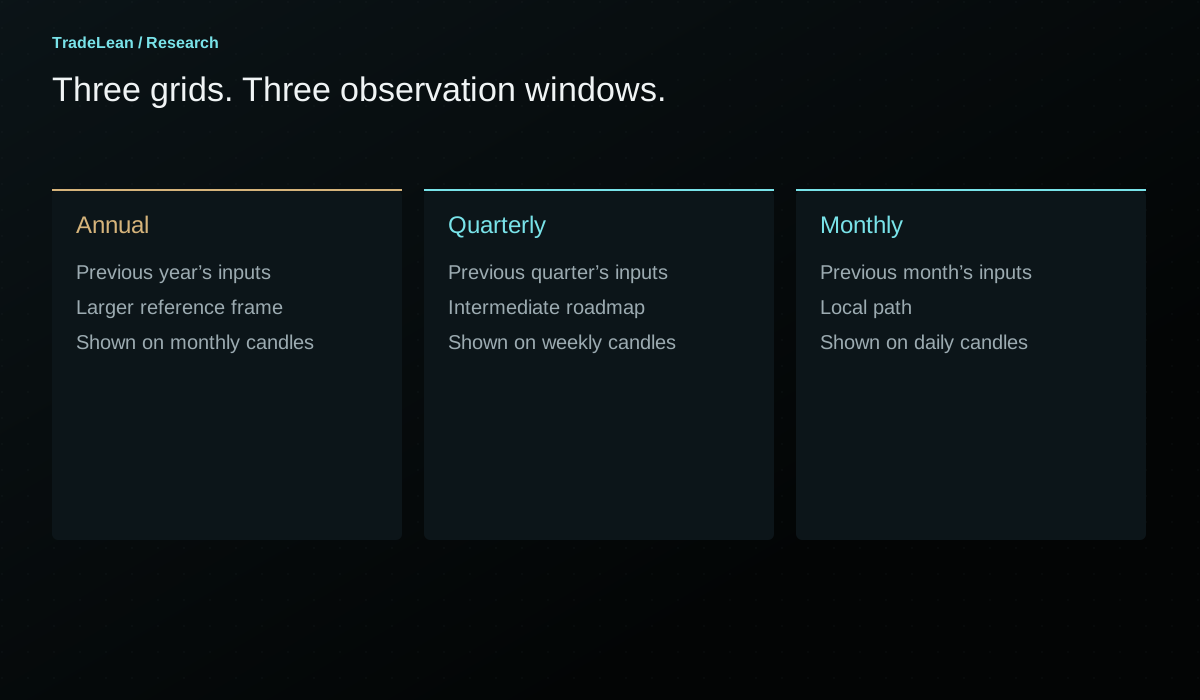
Connecting annual, quarterly and monthly pivot maps
How three grids describe one market: confluence, disagreement and the relationship between the larger reference frame and the local path.
Read the research ↗Pivot-point roadmaps, technical analysis and market foresight.
About TradeLean
I entered the markets in 2008. What stayed with me was the need for a clearer way to read price.
My work centres on pivot-point roadmaps: the levels, zones and timeframe relationships that help me understand where price is and what I’m watching next.
I combine that chart-based approach with historical research to explore possible paths and the evidence that would change my view.
My story and approach ↗Historical comparisons.
Forward-looking scenarios.
Compare price behaviour across historical periods and explore the paths that followed. The Price Projection Engine is being developed to bring those comparisons into an interactive research workspace.
Open Price Projection Engine ↗Pivot-point roadmaps and technical analysis, with key price levels and conditions for the next move.
Explore analysis ↗Historical comparisons and data-driven studies, with the methods and findings behind each conclusion.
Explore research ↗Economic developments, monetary policy and liquidity, placing market moves in a broader context.
Explore macro ↗How three grids describe one market: confluence, disagreement and the relationship between the larger reference frame and the local path.
Read the research ↗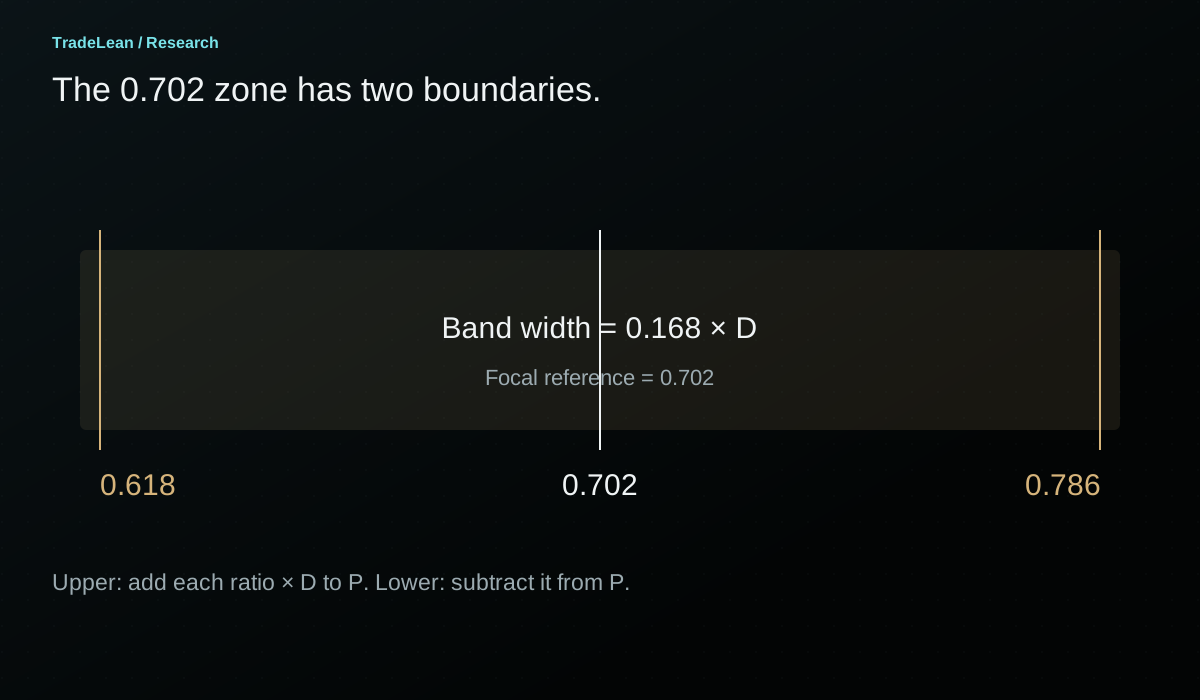
Why a focal line is not a breakout rule, how the outer band is calculated and what the recorded Bitcoin and S&P 500 examples actually show.
Read the research ↗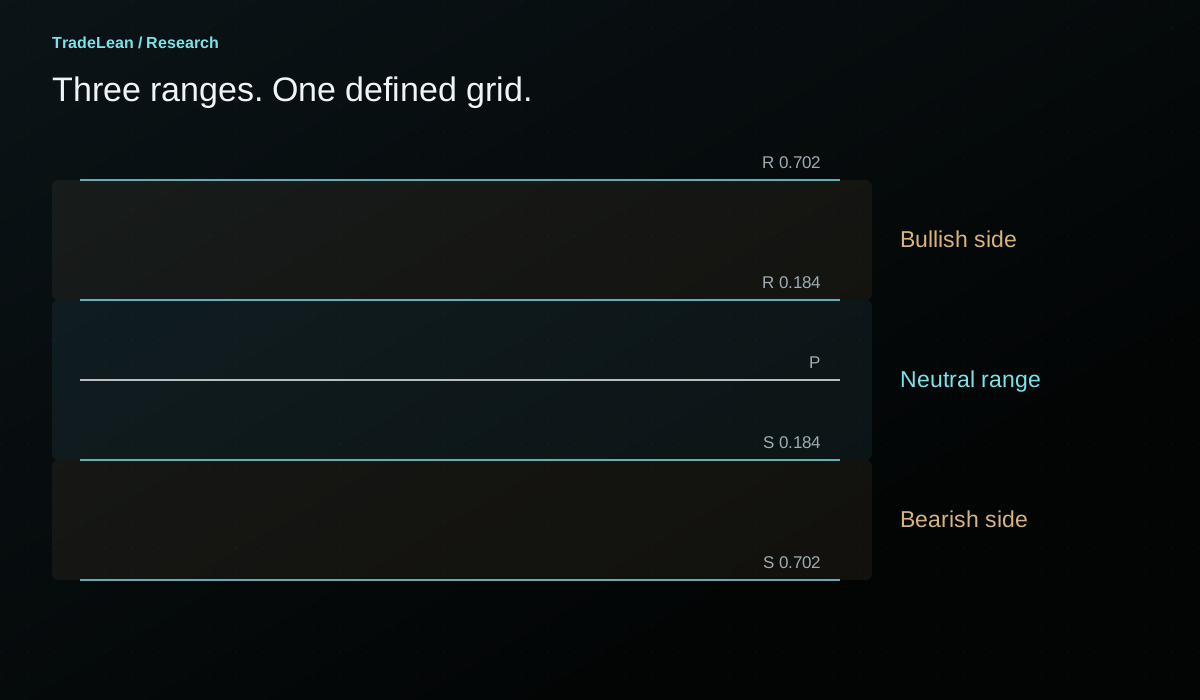
The three ranges, the closing conditions and the intermediate references that turn a pivot grid into a readable roadmap.
Read the research ↗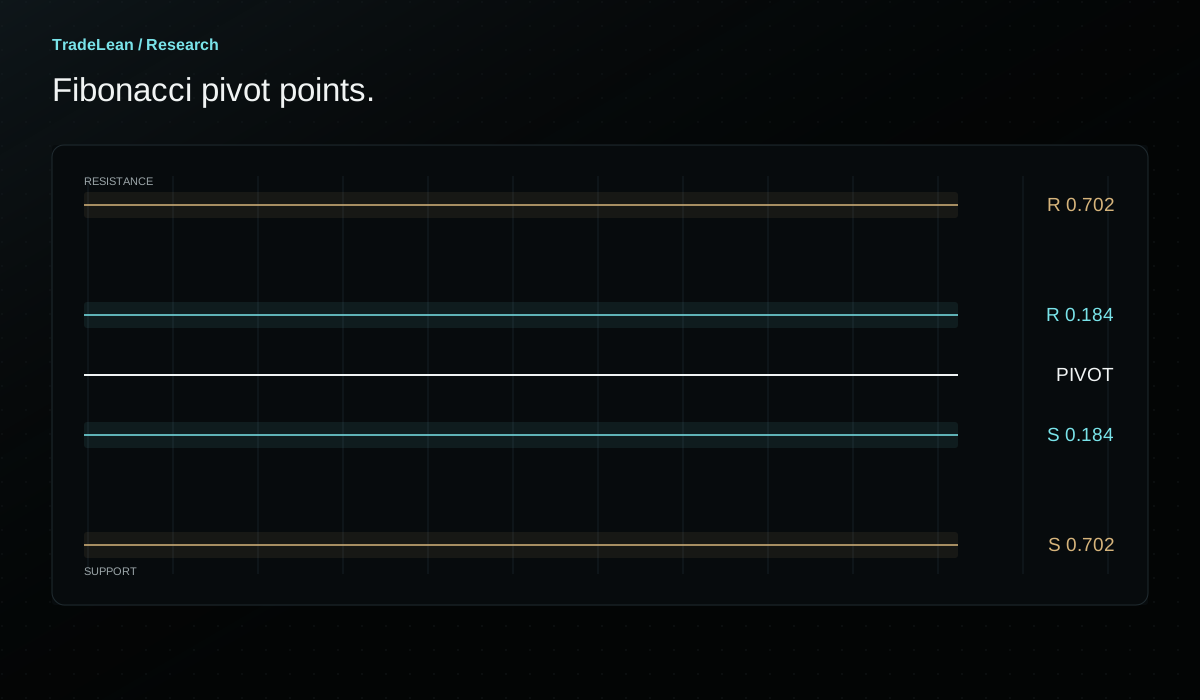
The formula, the TradeLean zones and Bitcoin’s annual roadmap, with original visuals and an interactive calculator.
Read the research ↗