

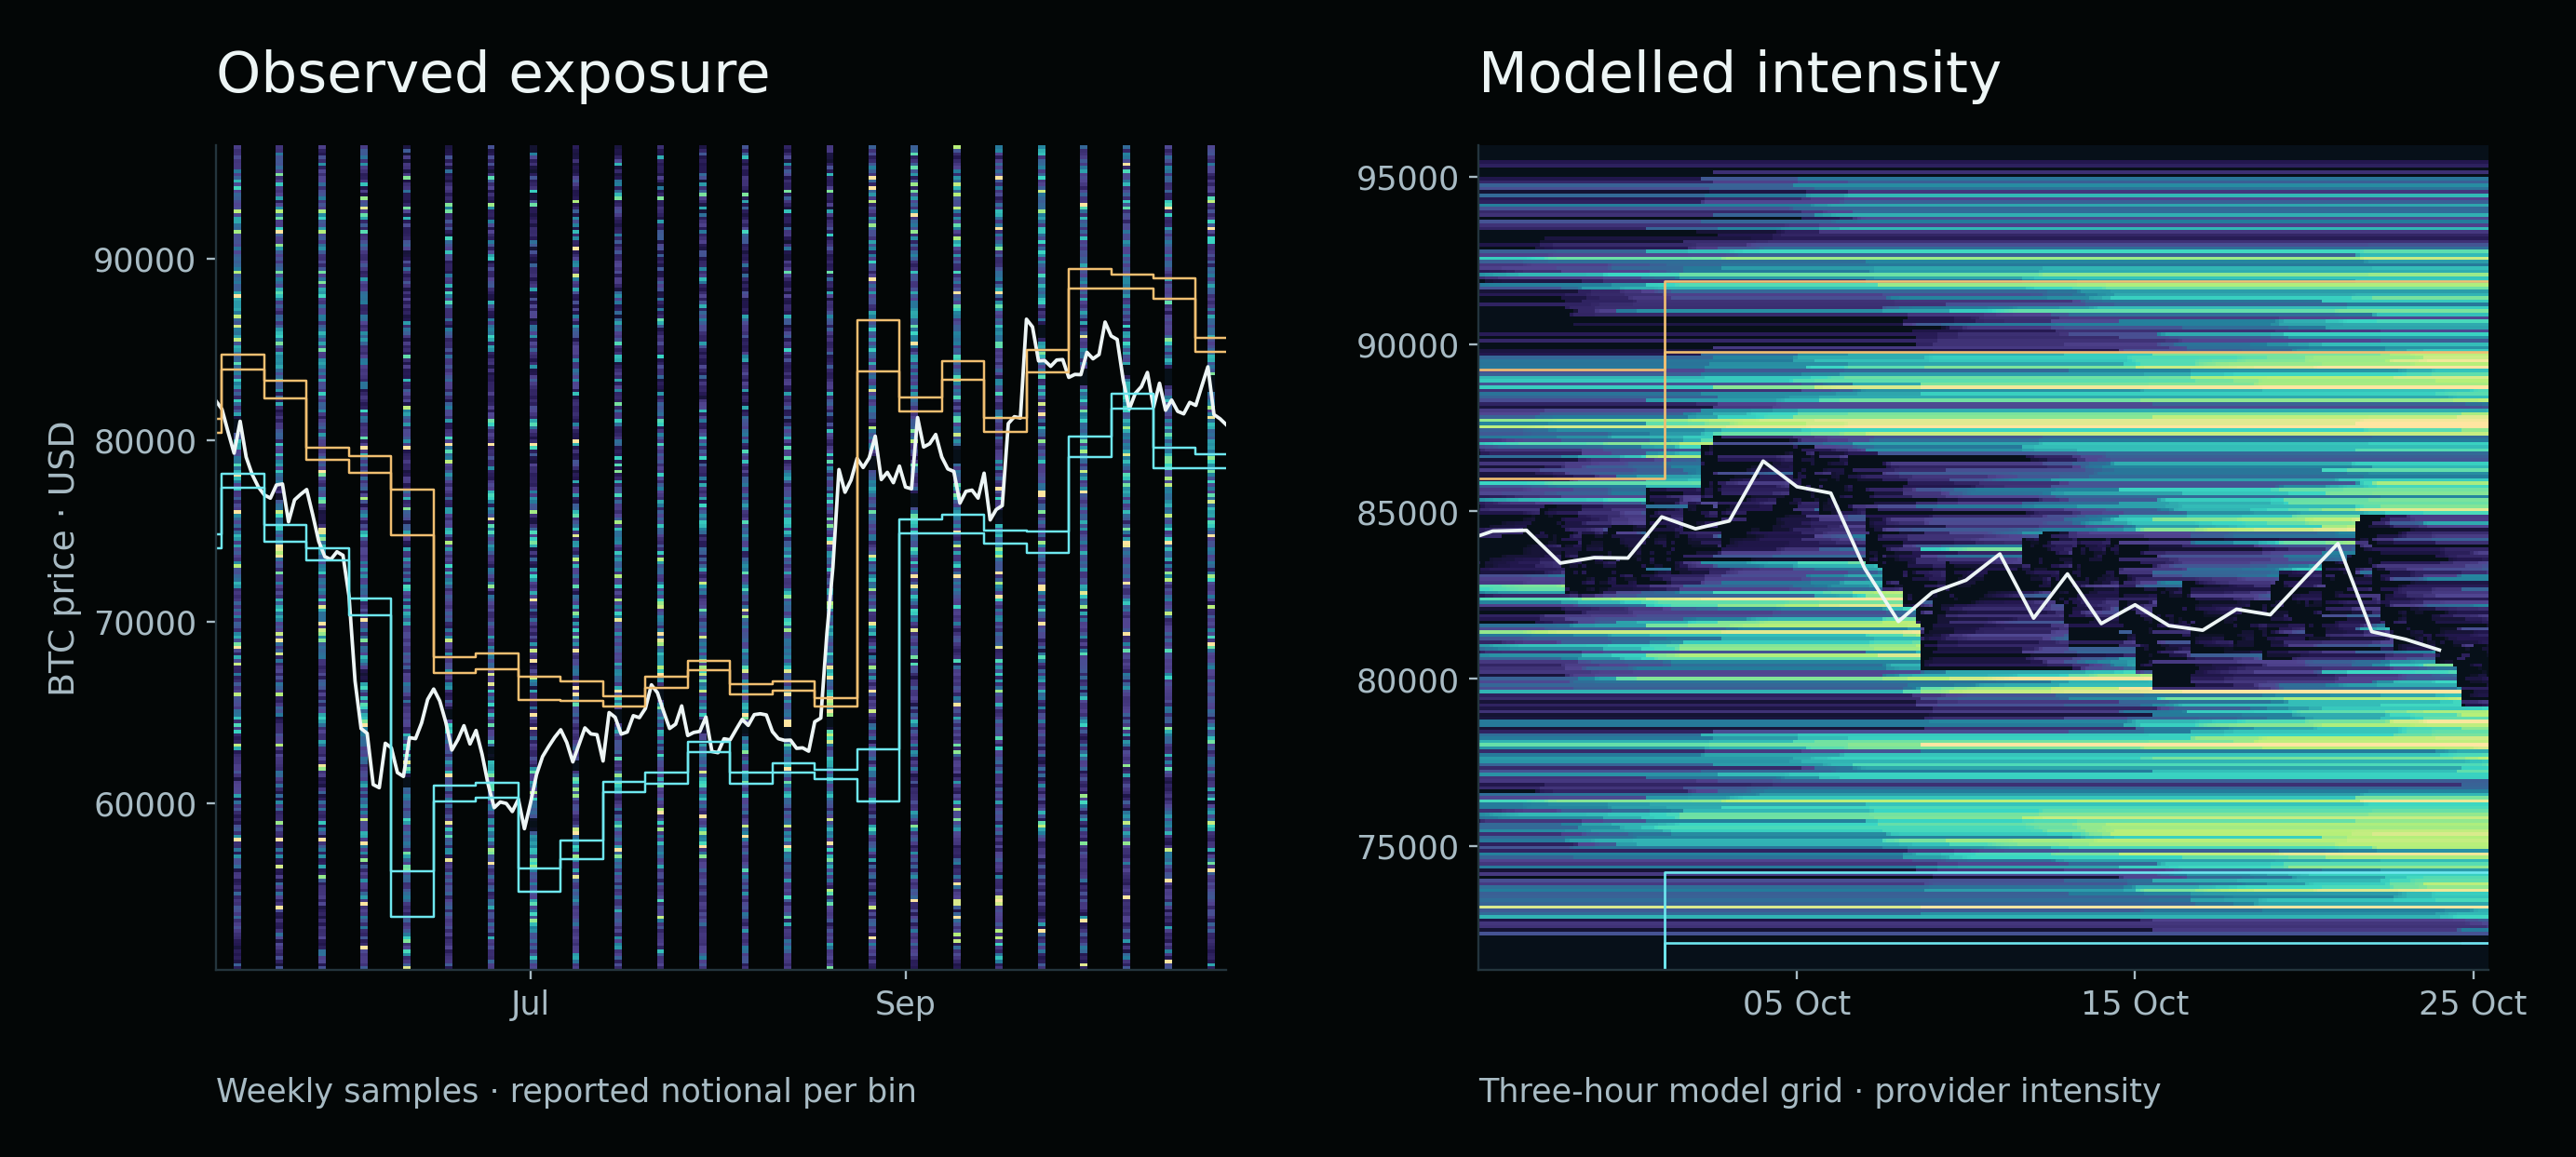
The liquidity behind the pivot zones
Measured exposure, interactive heatmaps and 80 major-asset comparisons around the outer pivot band.
Read the research ↗Pivot-point studies and historical comparisons, with clear methods, documented findings and the context behind each conclusion.
RSS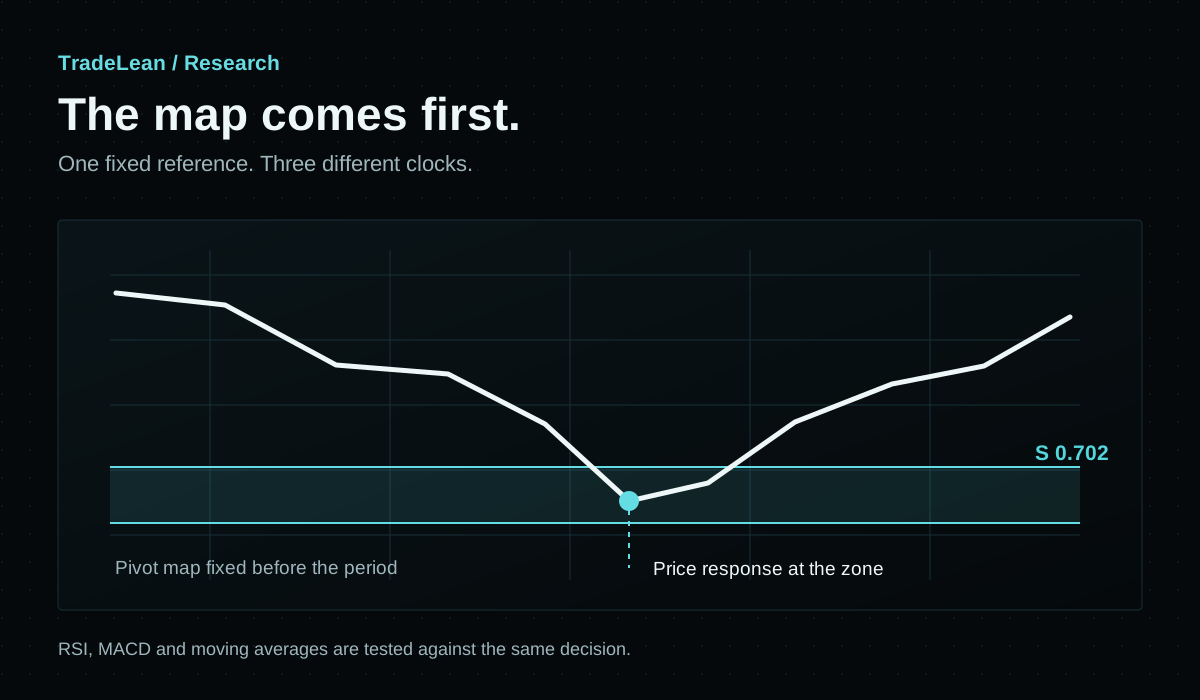
Fixed pivot zones, price response and a direct test of what RSI, MACD and moving averages add.
Measured exposure, interactive heatmaps and 80 major-asset comparisons around the outer pivot band.
Read the research ↗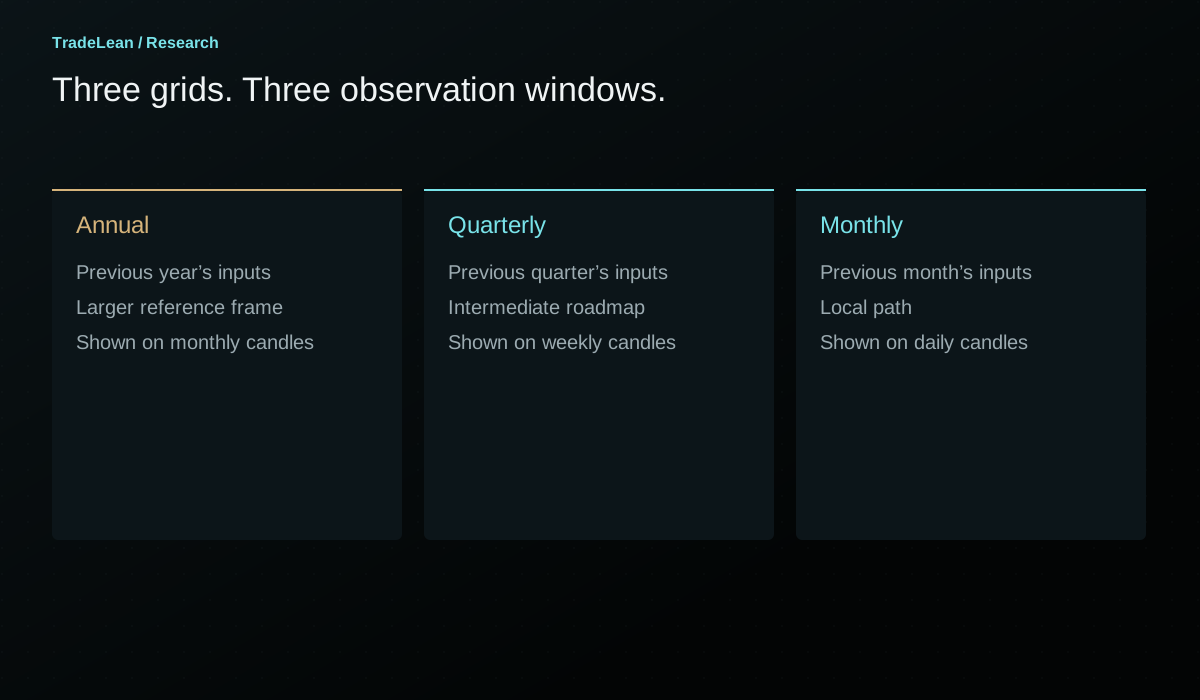
Confluence, disagreement and the relationship between the larger reference frame and the local path.
Read the research ↗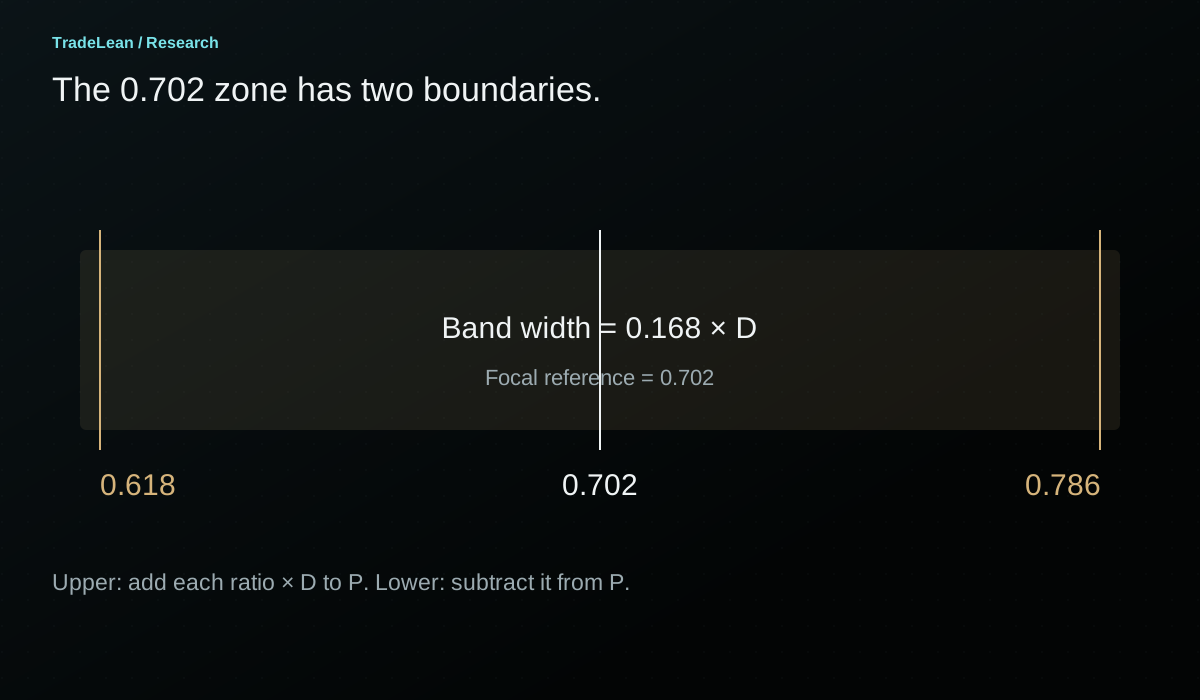
Why a focal line is not a breakout rule, how the outer band is calculated and what the recorded Bitcoin and S&P 500 examples actually show.
Read the research ↗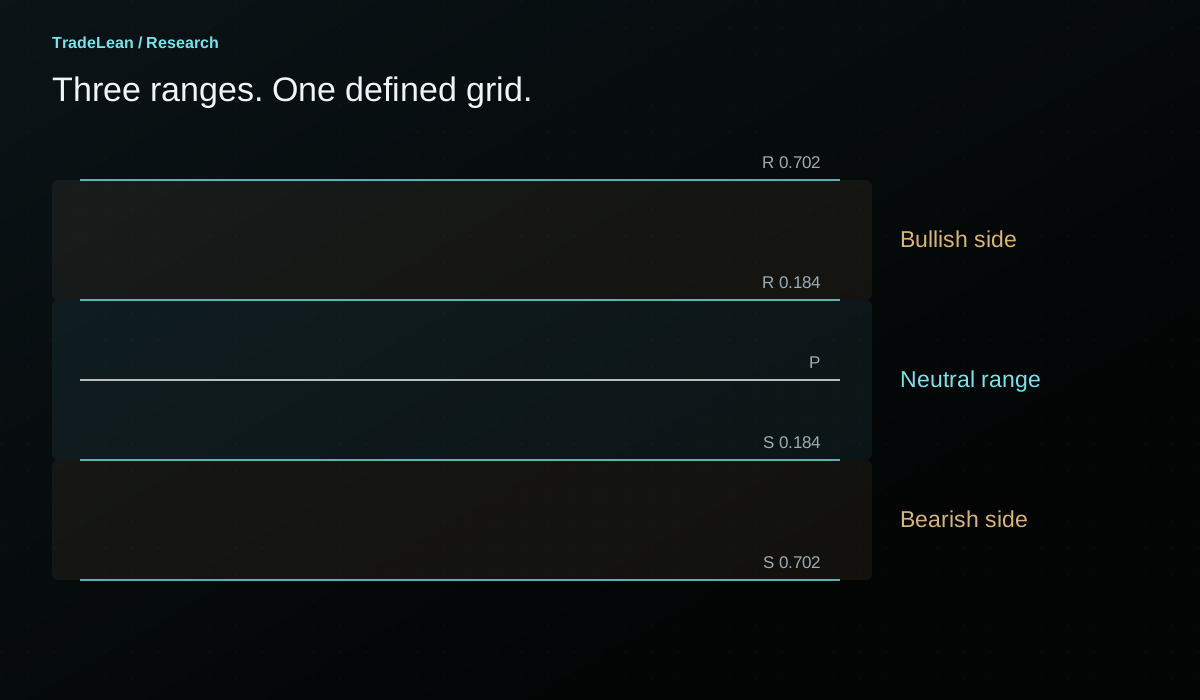
The three ranges, the closing conditions and the intermediate references that turn a pivot grid into a readable roadmap.
Read the research ↗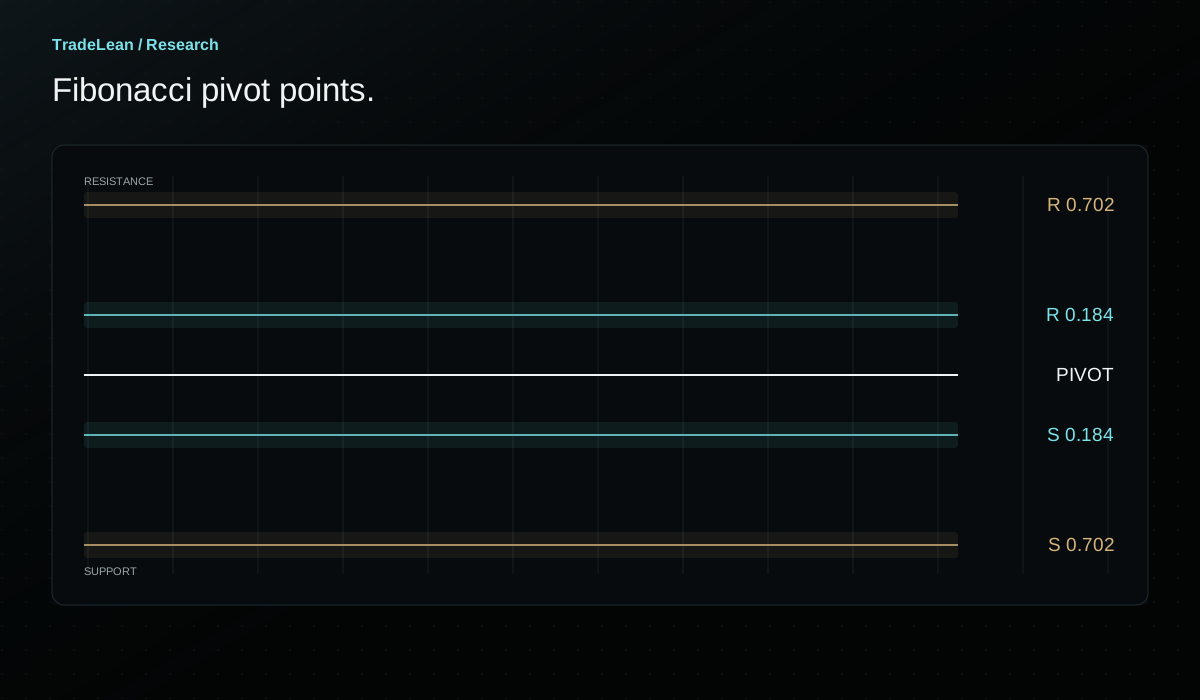
The formula, the TradeLean zones and Bitcoin’s annual roadmap, with original visuals and an interactive calculator.
Read the research ↗Pivot-point roadmaps, research notes and perspectives on the conditions shaping markets.