Understanding Market Structure
Discover the essentials of market structure - the basis for understanding price movement.

Introduction
Welcome to the deep dive into market structure, the foundational element of TradeLean Strategy.
This is the only resource you will ever need for understanding the concept of market structure.
Understanding market structure transforms your perspective on trading.
It’s not just about knowing when to buy or sell; it’s about understanding the underlying cycles and phases that drive the market.
This knowledge allows you to anticipate market changes, make more informed decisions, and ultimately, enhance your trading performance.
I'll explore the core components of market structure, breaking them down into digestible pieces of information.
Whether you’re looking to learn TradeLean strategy, to refine your own strategy or just starting out with trading, this post is designed to be your go-to resource for understanding market structure.
Market Cycle: Four Phases
Understanding the market cycle is fundamental to making informed trading decisions.
The market cycle can be broken down into distinct phases, each characterized by unique behaviors of market participants and price movements.
By analyzing these phases, traders can anticipate potential market trends and make strategic decisions that align with the cycle's current stage.
Market Cycle Phases
The market cycle consists of four primary phases: accumulation, mark-up, distribution, and mark-down.
Each phase represents a different period in the market's behavior and reflects the collective actions of all participants, from individual investors to large institutional players.

1. Accumulation Phase
The accumulation phase occurs after a prolonged downtrend when prices have bottomed out and are relatively stable.
During this phase, informed investors and institutions begin to buy assets at low prices, anticipating future price increases.
This phase is characterized by low volatility and low trading volume, as the market sentiment is still bearish, and the general public remains cautious.
- Characteristics of Accumulation: This phase often goes unnoticed by the general public because prices are relatively stable, and the overall market sentiment remains negative. However, keen observers may notice a gradual increase in buying interest, as indicated by slight upticks in trading volume and price stability.
- What do we do in this phase?: During the accumulation phase, savvy traders and investors start building positions in anticipation of a future uptrend.
2. Mark-Up Phase
Following the accumulation phase is the mark-up phase, where prices begin to rise significantly.
This phase is characterized by increased volatility and higher trading volumes as the market sentiment shifts from bearish to bullish.
More investors become aware of the uptrend, leading to increased buying activity and further price increases.
- Characteristics of Mark-Up: The mark-up phase is marked by higher highs and higher lows, indicating a strong uptrend. During this phase, positive news and economic indicators often reinforce the bullish sentiment, attracting more investors into the market.
- What do we do in this phase?: Traders and investors who recognized the accumulation phase benefit from the mark-up phase as prices increase. Momentum traders also enter the market during this phase, aiming to capitalize on the upward trend.
3. Distribution Phase
The distribution phase follows the mark-up phase and represents a period where the initial investors begin to sell their holdings at higher prices.
This phase is characterized by increased volatility and trading volume, as the market sentiment becomes mixed.
While some investors are still optimistic, others start to take profits, leading to a more balanced supply and demand dynamic.
- Characteristics of Distribution: During the distribution phase, prices may appear to move sideways as the market struggles to make new highs. There is often a tug-of-war between buyers and sellers, resulting in a trading range.
- What do we do in this phase?: Savvy investors and traders start to reduce their positions during the distribution phase, recognizing that the uptrend is losing momentum. It's essential to look for signs such as declining volume on up days and increased volume on down days, which indicate distribution.
4. Mark-Down Phase
The mark-down phase is the final phase of the market cycle, where prices decline significantly.
This phase is characterized by panic selling and a bearish market sentiment.
As prices continue to fall, more investors exit their positions, leading to further declines in prices.
- Characteristics of Mark-Down: The mark-down phase is marked by lower lows and lower highs, indicating a strong downtrend. Negative news and economic indicators often exacerbate the bearish sentiment, causing more selling pressure.
- What do we do in this phase?: During the mark-down phase, traders may adopt short-selling strategies to profit from the declining prices. Long-term investors might look for signs of capitulation, where the selling pressure reaches its peak, potentially signaling the beginning of a new accumulation phase.
Trading Ranges: Accumulation and Distribution
Trading ranges are periods of relative equilibrium between supply and demand, where prices move sideways.
These ranges can occur during both accumulation and distribution phases and provide opportunities for traders to enter positions with favorable risk/reward ratios.
- Accumulation Ranges: In accumulation ranges, large investors gradually buy shares, preparing for a future uptrend. Recognizing these ranges allows traders to enter long positions before the market moves higher.
- Distribution Ranges: In distribution ranges, large investors gradually sell their holdings, preparing for a future downtrend. Identifying these ranges helps traders exit long positions and potentially enter short positions before prices decline.
The market cycle is driven by the fundamental economic principle of supply and demand.
Prices rise when demand exceeds supply and fall when supply exceeds demand.
By analyzing price action, volume, and time, traders can gauge the balance between supply and demand and anticipate future price movements.
Supply and Demand in Action
- Price Action and Volume: Observing the relationship between price movements and trading volume provides insights into the underlying supply and demand dynamics. For instance, rising prices accompanied by increasing volume indicate strong demand, while rising prices with decreasing volume may suggest weakening demand.
- Time Factor: The duration of each phase in the market cycle can vary. Some phases may last for months, while others may span years. Understanding the time factor helps traders develop patience and avoid premature decisions.
Understanding the market cycle and its underlying principles equips traders with the tools to make informed decisions.
Mastering the market cycle is essential for successful trading.
By understanding the distinct phases—accumulation, mark-up, distribution, and mark-down—traders can anticipate market movements and make decisions that align with the cycle's current stage.
Incorporating market cycle analysis into your trading strategy not only enhances your ability to navigate the markets but also empowers you to take advantage of opportunities and mitigate risks.
Whether you are a beginner or an experienced trader, an understanding of the market cycle will undoubtedly contribute to your trading success.
So, let the market cycle guide you towards better trading outcomes.
Market Structure: Trend and Sideways Market
Markets are always in motion.
They never stand still because they are driven by the continuous actions of buyers and sellers.
This is true for the markets that operate all the time, such as Cryptocurrency Market, even when traditional financial markets like Stock Market and Forex Market are closed.
During these off-hours, traders often engage in over-the-counter (OTC) transactions, where many significant deals take place affecting the demand-supply equilibrium.
When a market moves, there's always specific behavior behind these movements.
When the market moves continuously in one direction, we call it a trend.
It doesn’t matter whether this trend is moving up or down; it's all part of the market’s rhythm.
Linking it to the previous section on this page, trend could be attributed to mark-up or mark-down phases of the market cycle.
Conversely, when the market doesn’t show a clear directional bias and instead moves within a range, we call it a sideways market or consolidation.
Again, connecting it back to Market Cycle, we refer to sideways market as accumulation or distribution.
Understanding Market Trend and Structure
In a trend, either bulls or bears are in full control.
That's why trends are generally more recognisable and predictable than sideways markets.
However, the strength of a trend can vary.
A sideways market might seem boring and slow, but it can be very profitable when it breaks out from its range and starts a new trend.
These elements come together to form the overall market structure.
As a rule of thumb, trends have the impulsive nature of the price movement, while sideways market has a corrective nature.

This is normal, and as traders, we need to embrace both market conditions.
A market can move continuously upwards or downwards.
When prices consistently rise, we call it an uptrend.
Conversely, when prices consistently fall, we call it a downtrend.
There’s no inherently good or bad trend; it’s all part of the market process.
Among retail traders, downtrends are often seen negatively, but the market itself doesn’t care.
Up or down, both are parts of the same market process, and both offer equal opportunities for traders.
In technical terms, there’s no fundamental difference between an uptrend and a downtrend.
Both can provide trading opportunities, but you need to wait for the trend to shift to get a new directional bias.
In an uptrend, you should look to buy on dips, whereas in a downtrend, you should look to sell at local highs.
Recognizing Market Structure
Uptrend
In an uptrend, the market consistently makes higher highs (HH) and higher lows (HL).
Each peak is higher than the last, and each trough is also higher, indicating a strong upward momentum.
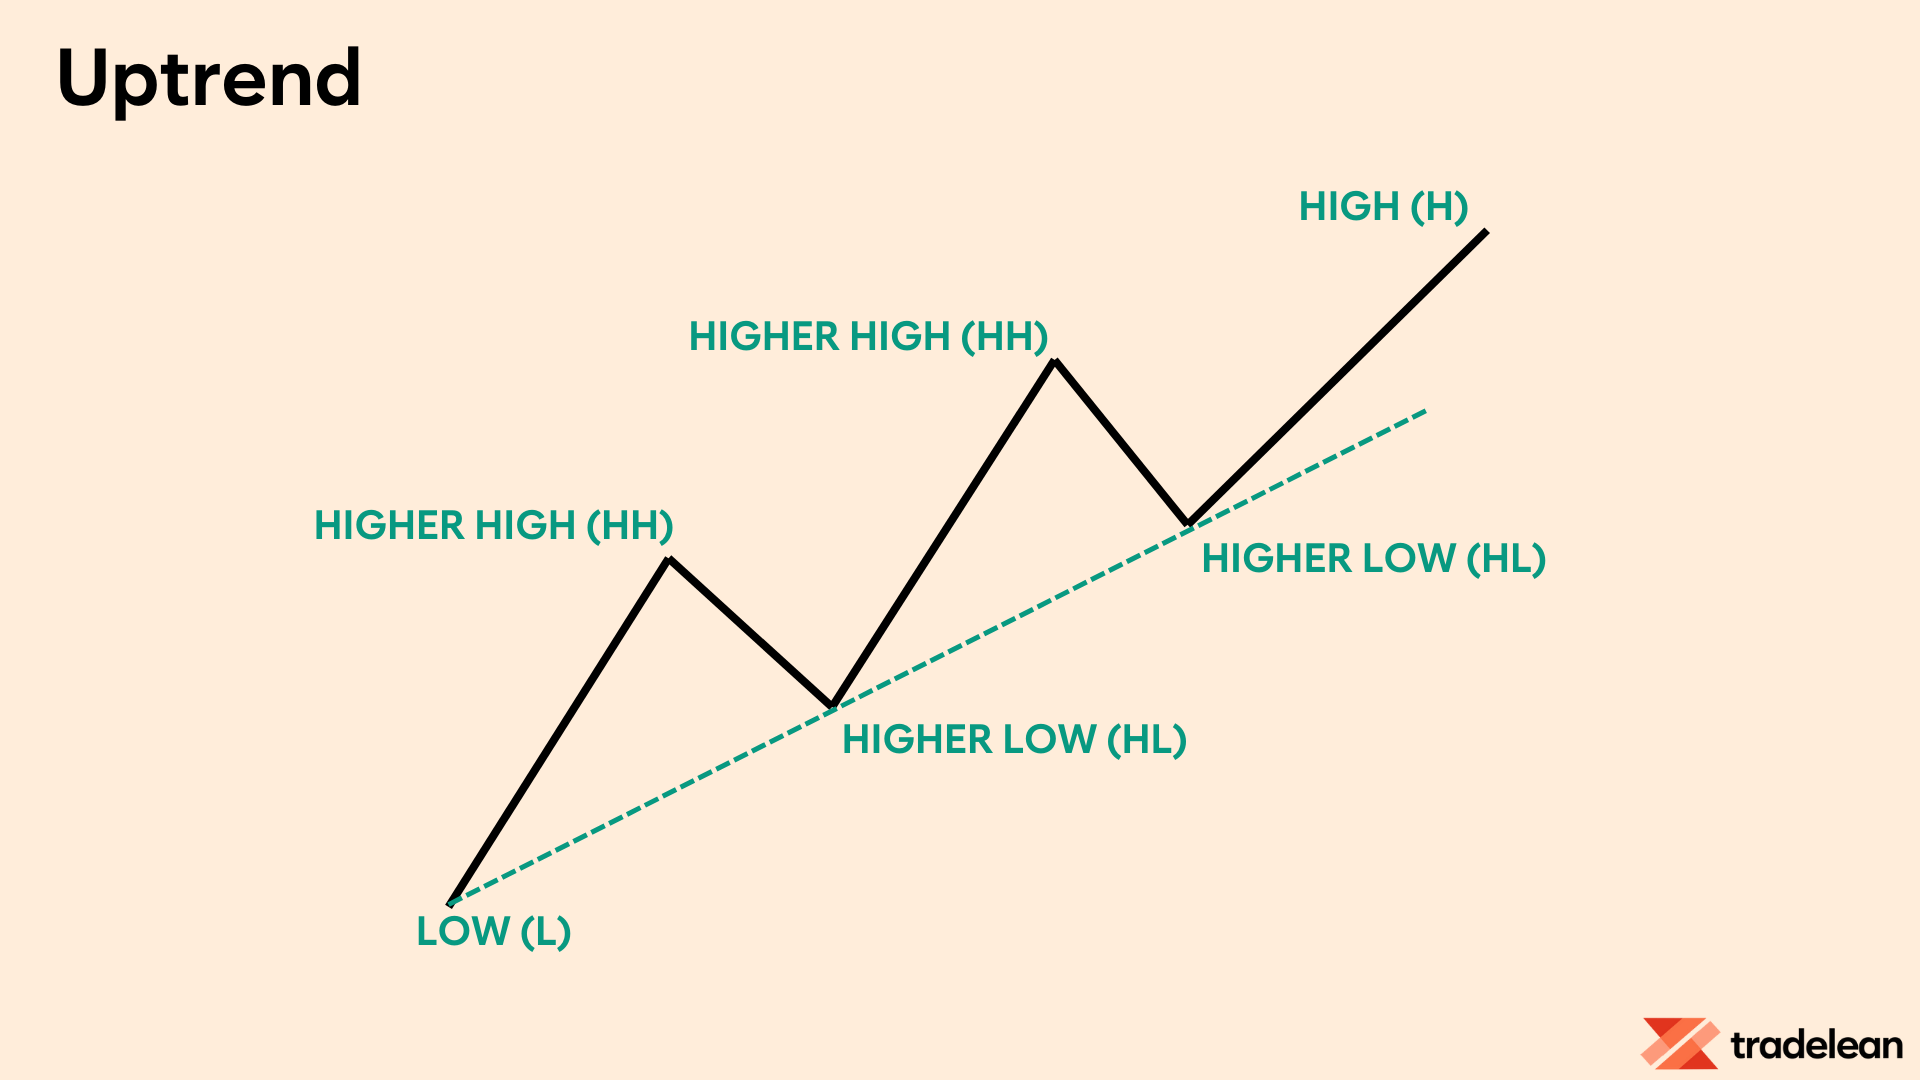
Higher Highs and Higher Lows: This is the most recognizable feature of an uptrend. Imagine climbing a staircase—each step (high) is higher than the last, and each rest point (low) is also higher than the previous one.
Downtrend
In a downtrend, the market makes lower highs (LH) and lower lows (LL).
Each peak is lower than the last, and each trough is also lower, showing a continuous decline.
Lower Highs and Lower Lows: Picture walking down a slope. In a bearish trend, each peak (high) you reach is lower than the last, and each valley (low) is also lower. This indicates a continuous decline.
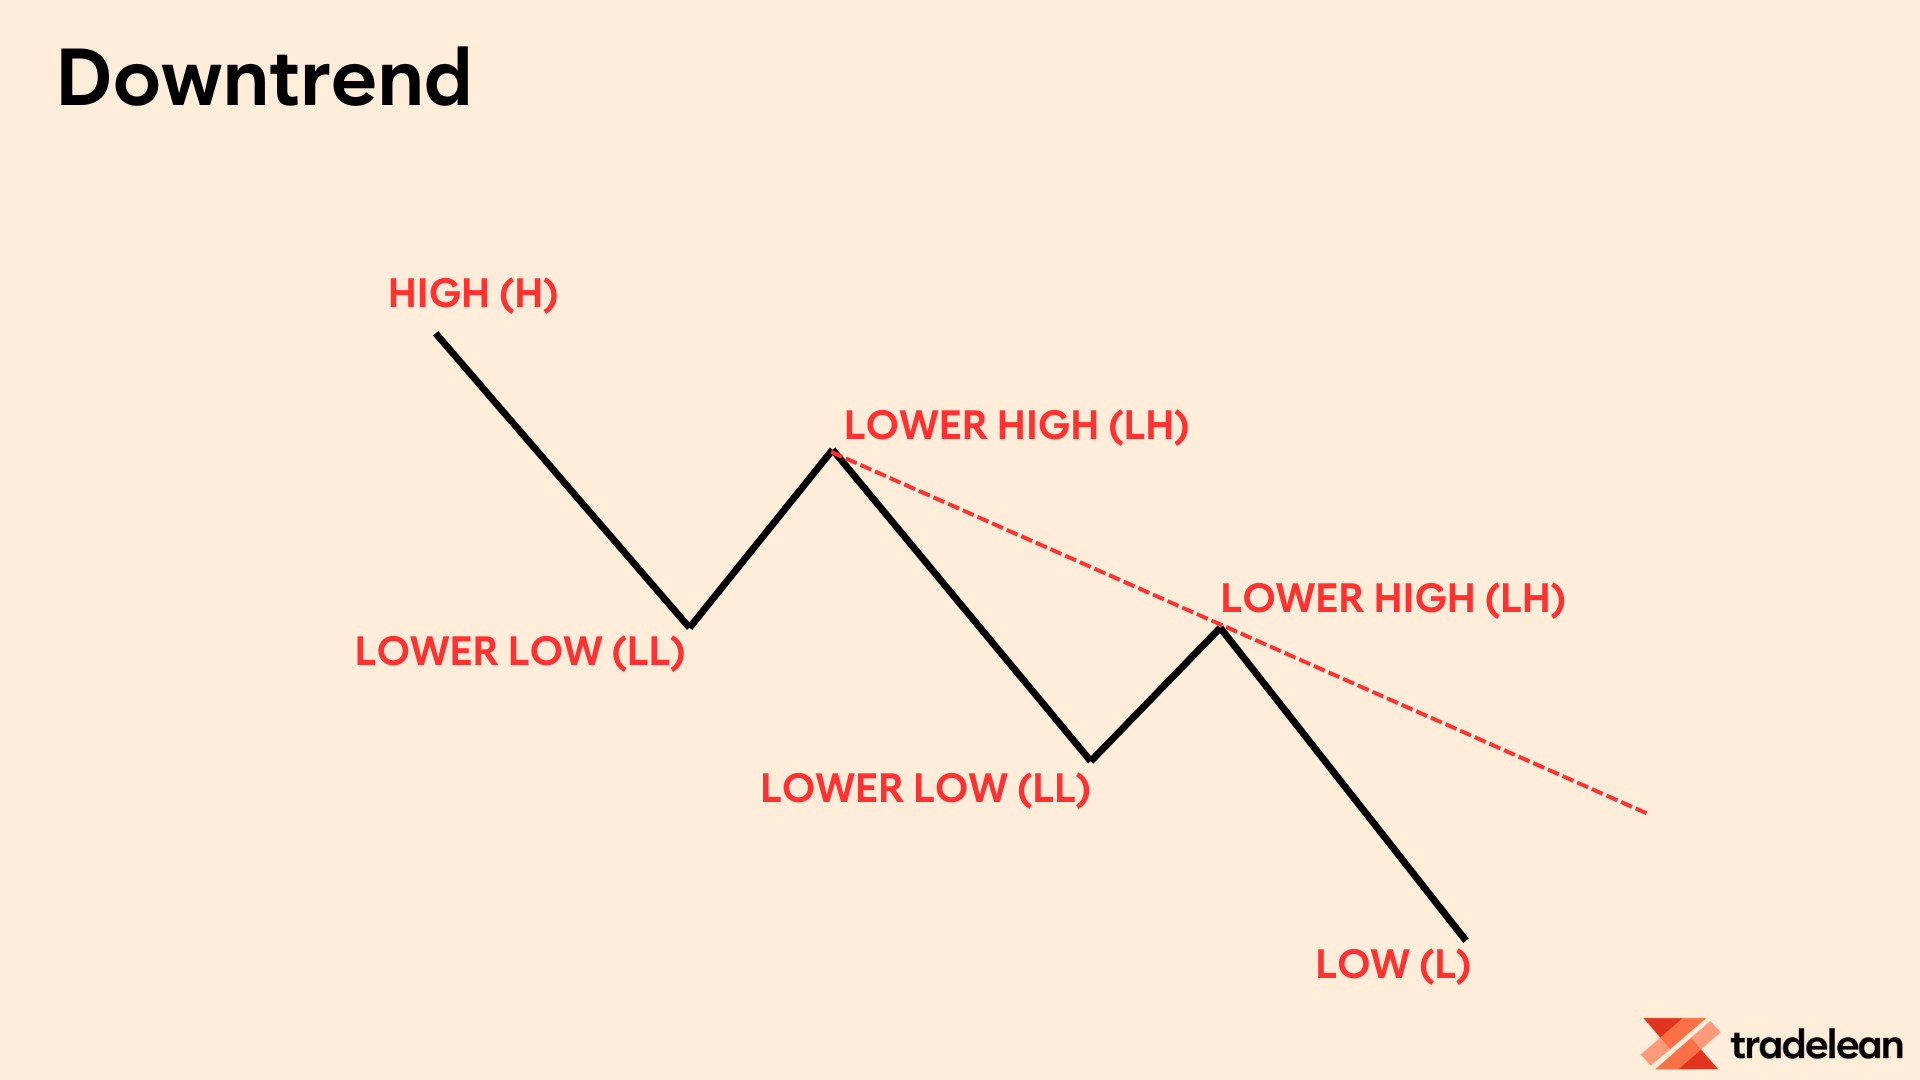
The above defines a structure of the market!
You don't need a bunch of fancy indicators to recognize the trend and understand its nature.
Just use the trend line!
Draw a line connecting the lows of price movements.
If it’s sloping upwards, congratulations, you're in a bullish trend.
If it’s sloping downwards, you’re looking at a bearish trend.
Identifying and Prioritizing Trends
Identifying a trend and knowing what to prioritize can be complicated and requires experience.
This process can depend on many factors, such as the timeframe you are observing.
The higher the timeframe, the broader the macro view.
Thus, a trend in the macro view can be different from a trend in a lower timeframe, and there is nothing wrong with that if you have a lot of experience, know how to adapt and trade accordingly.
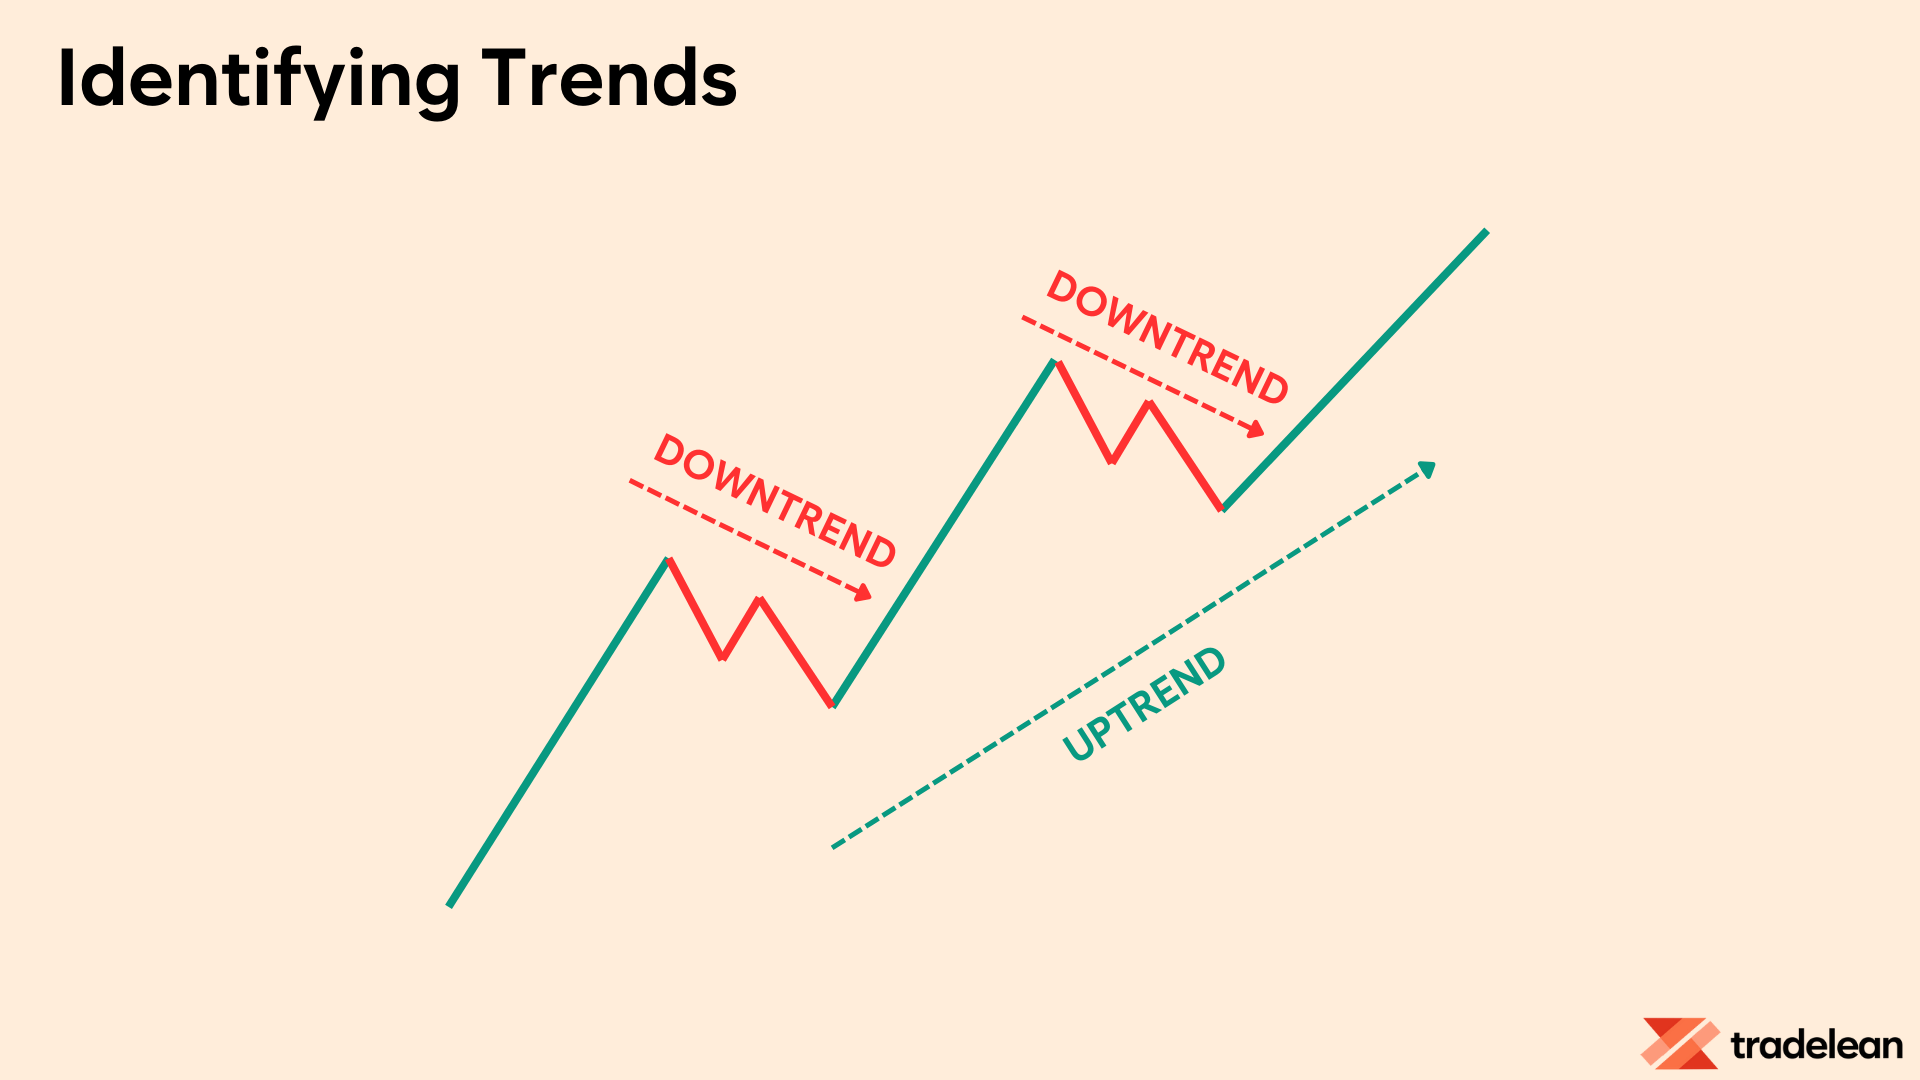
Having said that, I have to remind you, that the trend is your friend and caution you, not to trade against the trend!
Make sure you are aware of your goals and manage your expectations depending on the timeframe you are using.
Don’t focus on everything at once.
If you trade a low timeframe, you should always check what is the macro trend at a higher timeframe.
Sideways Market
After a trendy move, the market usually starts to move slower, which is a possible reversal to the trend.
Remember Accumulation and Distribution phases?
However, the market can also simply slow down for a while and gather energy to move in the original direction.
This is the most boring part of trading as retail traders get confused with the trend and the moves since the market does not go towards their expected target.
This type of market makes Higher Highs and Lower Lows or Lower Highs and Higher Lows, confusing traders.
A trading area like this market simply moves with ups and downs and does not respect other price actions.
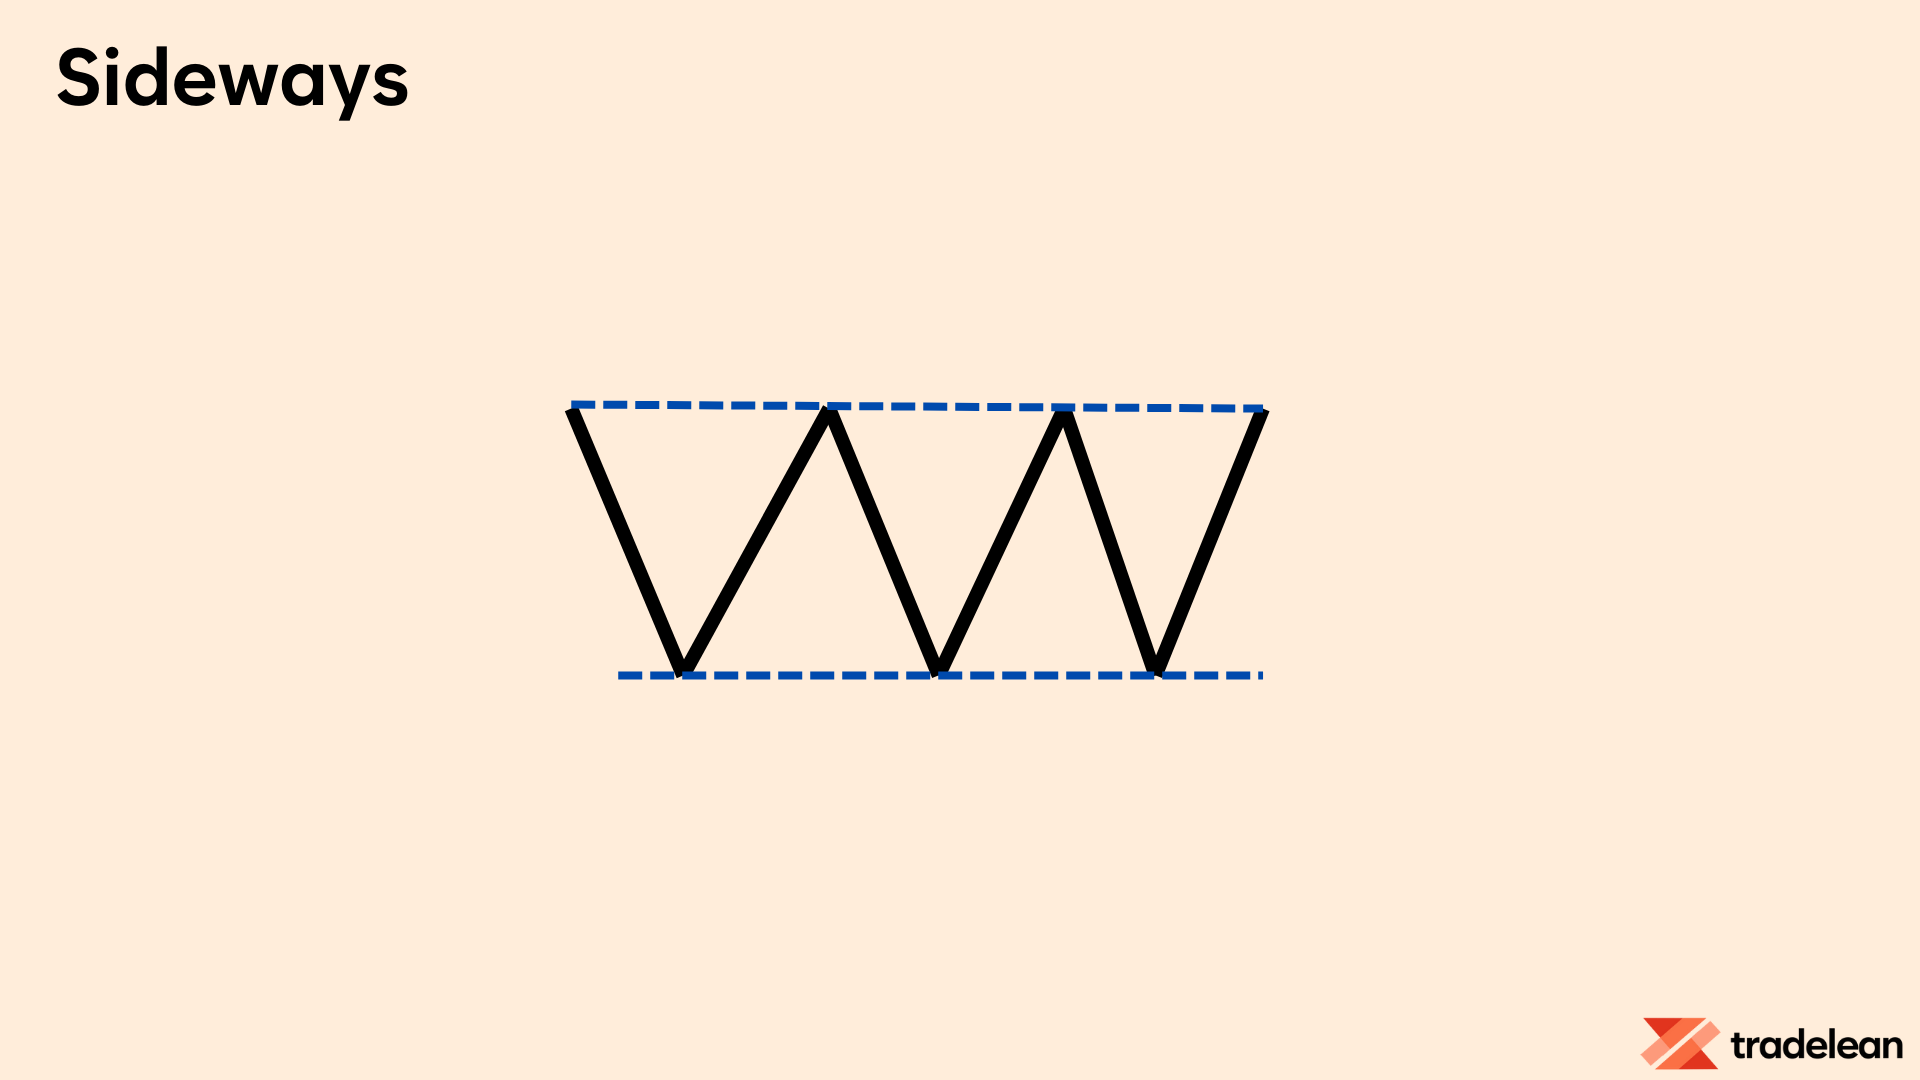
In fact, when the market does not move or moves sideways, it almost always forms a chart pattern.
In a sideways market, you should be looking for chart patterns.
There are dozens of chart patterns out there to follow, but in the next section of this post I will highlight the most important ones.
In summary, understanding and navigating market trends—whether they are bullish, bearish, or sideways—is fundamental to successful trading.
Changes in the Market Structure
I have already covered a concept of price forming Higher Highs (Lows) and Lower Highs (Lows) that results in a certain market structure.
Now, let's cover the transition periods when the market structure changes.
Navigating market structure effectively requires a clear understanding of the differences between a Break of Structure (BOS), Change of Character (ChoCh), and Market Structure Shift (MSS).
Each concept signals different aspects of market behavior and helps traders make informed decisions.
Break of Structure
A Break of Structure, or BOS, indicates the continuation of the current trend.
It occurs when the market forms a new high in an uptrend or a new low in a downtrend, reinforcing the existing directional momentum.
This action signifies strength in the prevailing trend without suggesting a reversal.
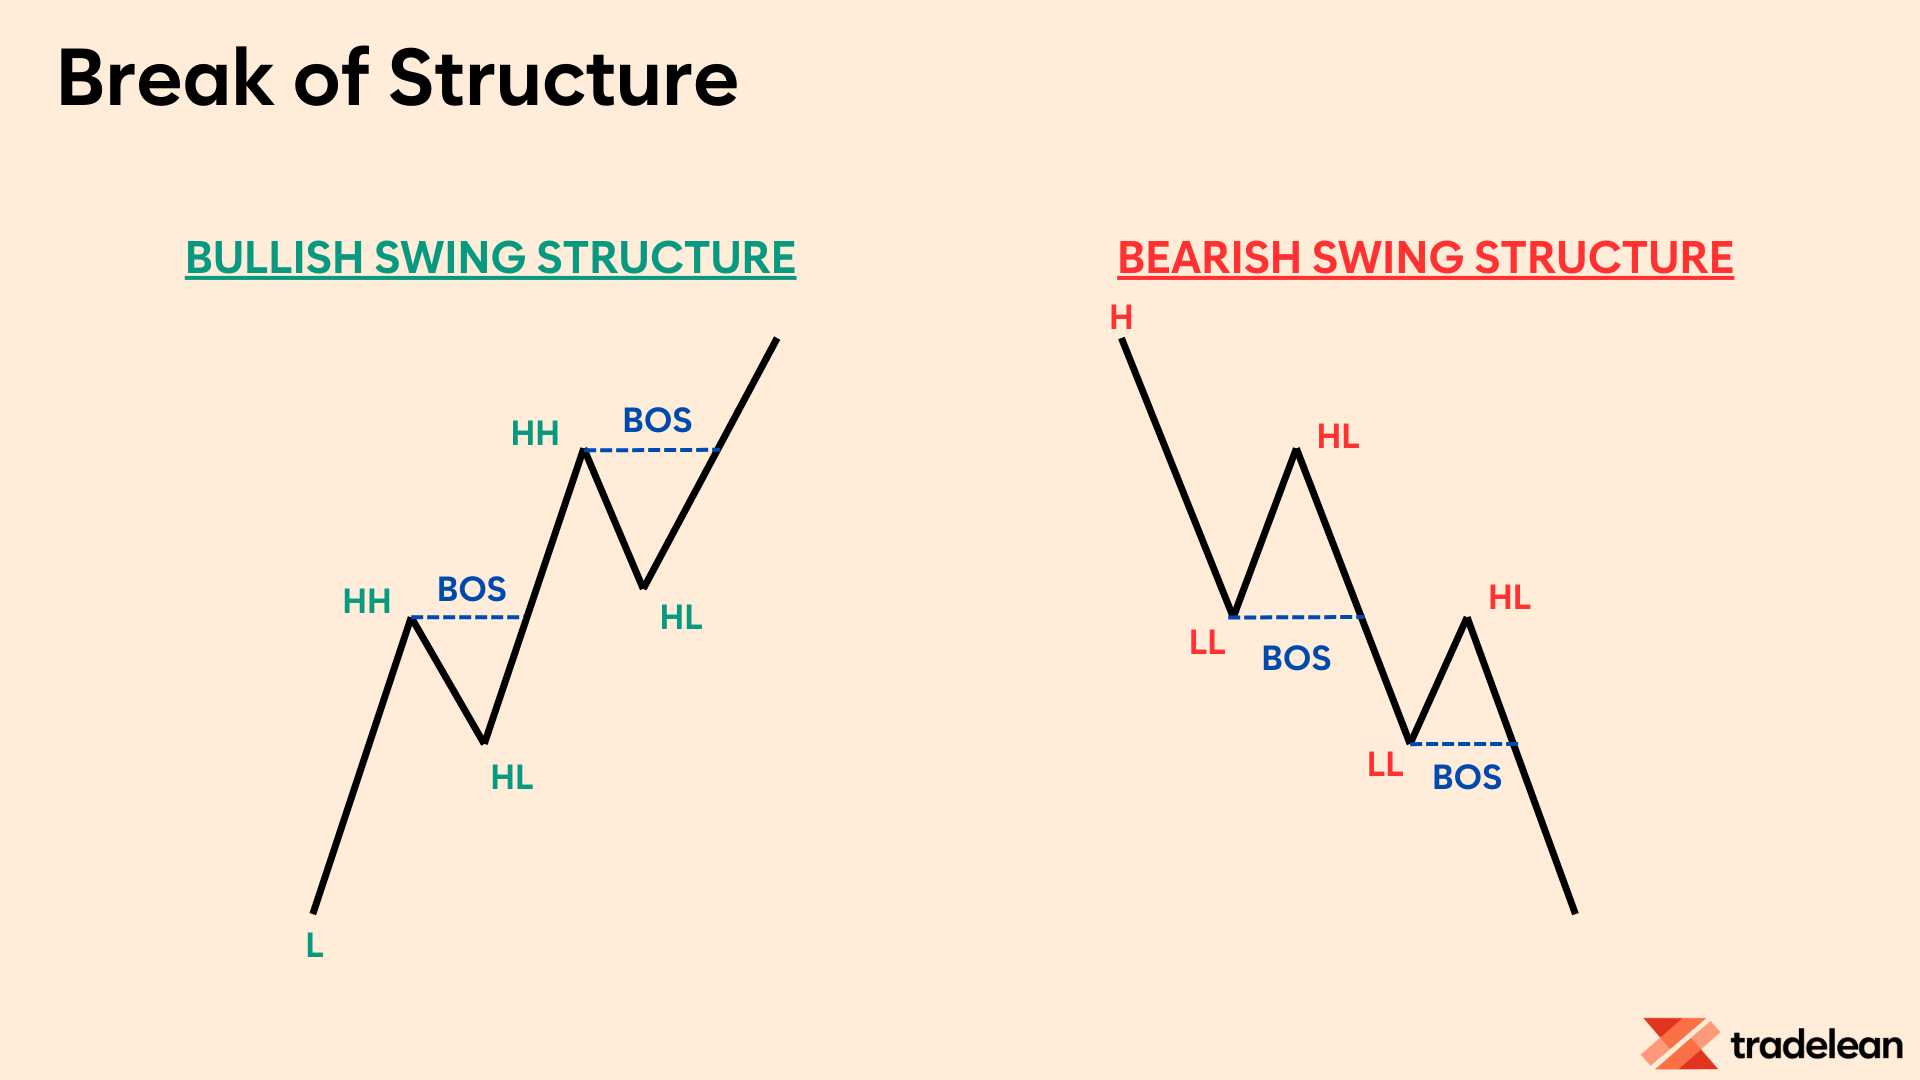
- Uptrend: A new higher high is formed.
- Downtrend: A new lower low is established.
- Implication: Continuation of the current trend, confirming its strength.
Change of Character
While a BOS aligns with the trend’s direction, a Change of Character, or ChoCh, represents a break in the opposite direction.
It happens when a previously strong swing point, which should act as a barrier to protect the trend, is breached.
This breach, especially if it involves a significant swing point, might suggest the onset of a new trend, challenging the current trajectory.
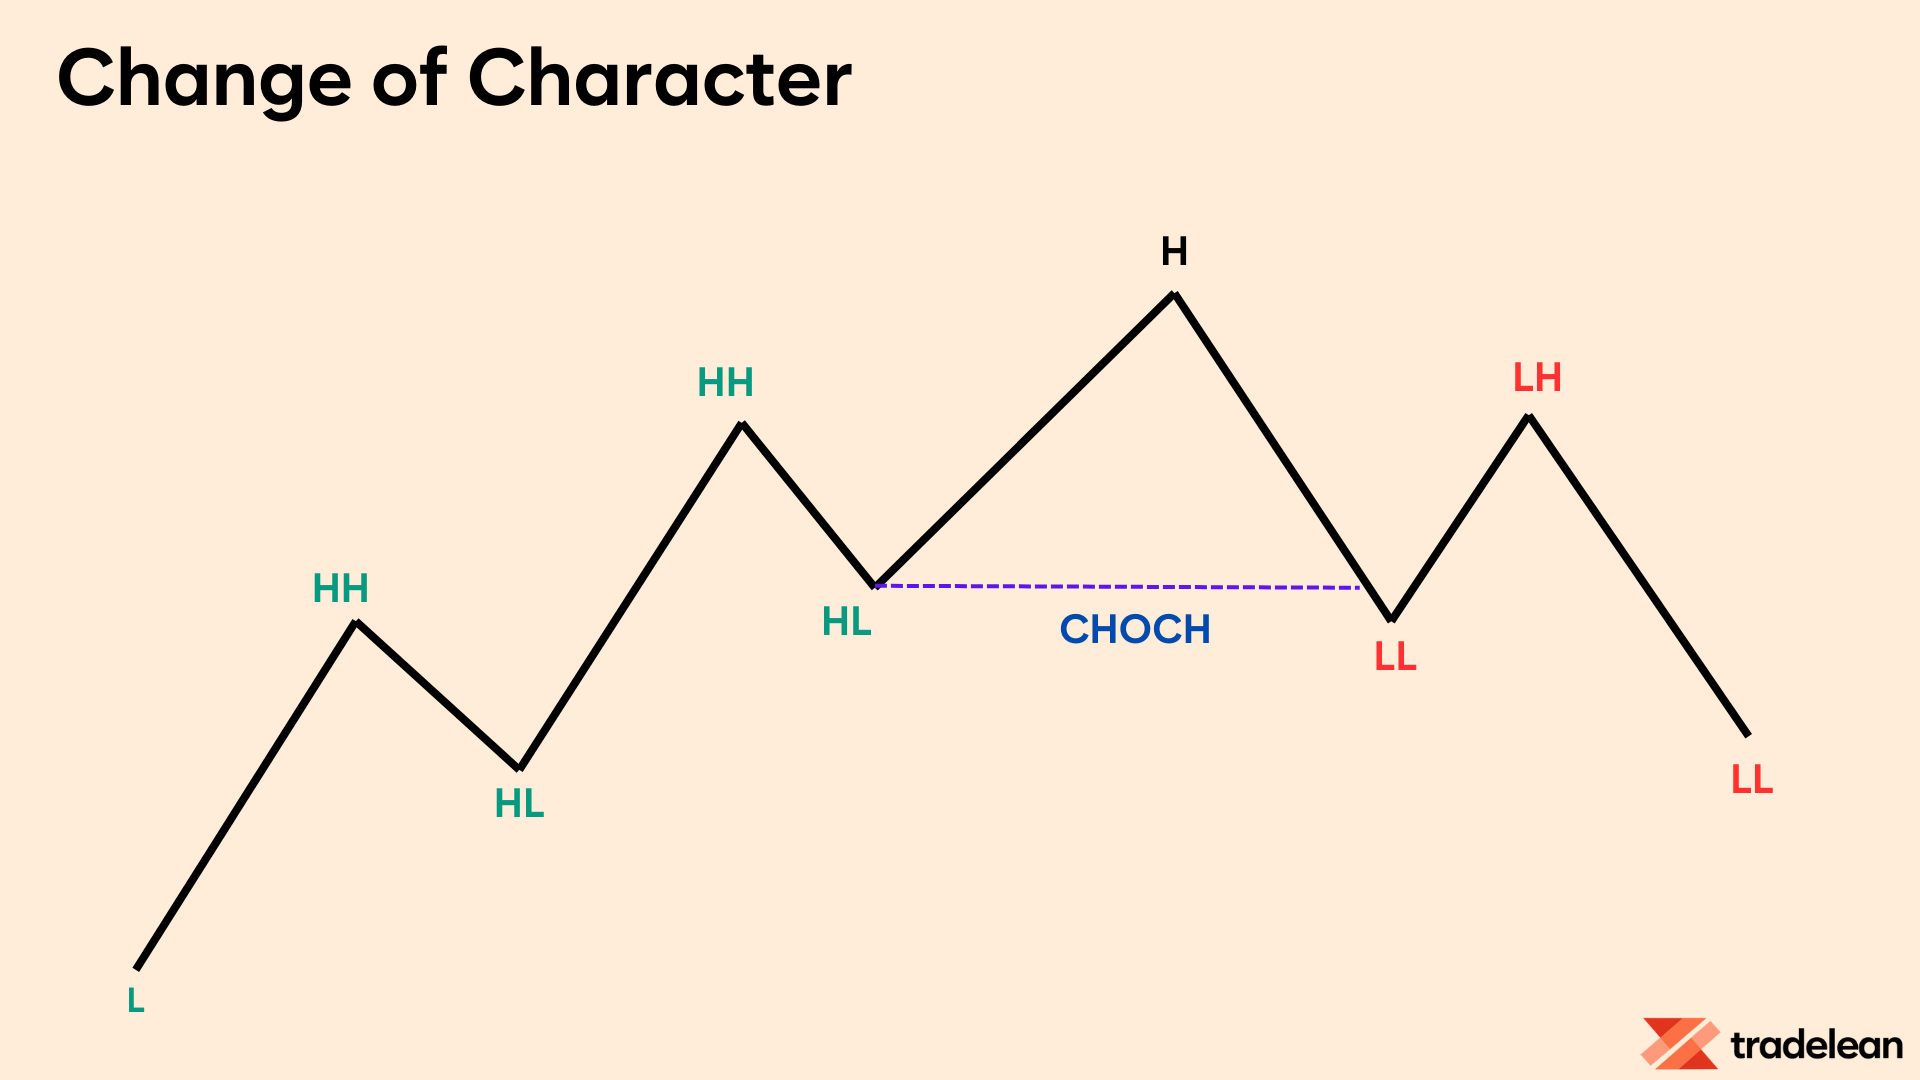
- Uptrend: A significant swing low is breached.
- Downtrend: A significant swing high is breached.
- Implication: Potential start of a new trend, indicating a change in market sentiment.
Market Structure Shift
A Market Structure Shift, or MSS, embodies the principles of a ChoCh but with additional confirmation of a potential trend reversal.
Before a strong swing point is decisively broken, the market first fails to continue the trend by plotting a higher low (in a bull market) or lower high (in a bear market) but fails to create a new higher high or lower low.
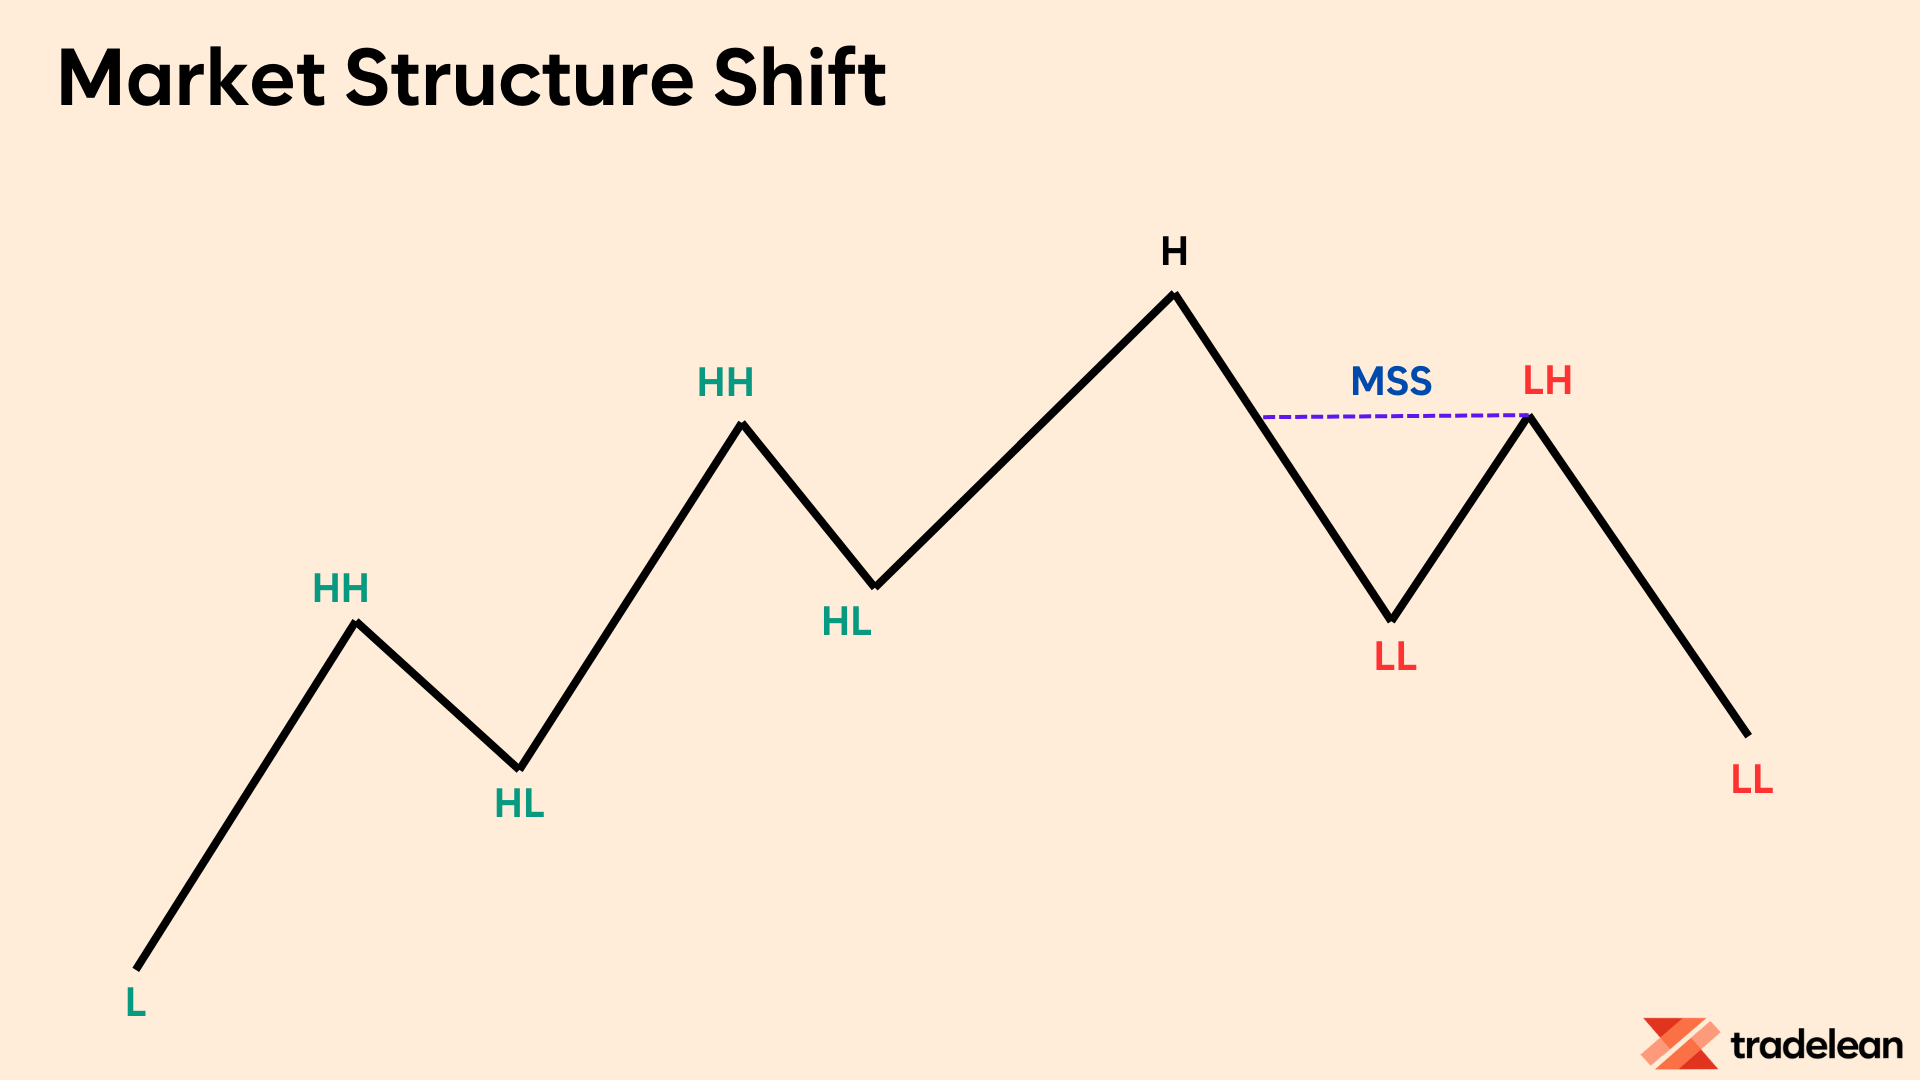
An MSS involves a significant impulse move that breaks a key swing point with force, indicating that not only has the current trend paused, but a new trend in the opposite direction has begun to establish itself.
This is marked by lower highs in an uptrend or higher lows in a downtrend before the break.
- Initial Signs: Failure to make a new higher high or lower low.
- Confirmation: A strong impulse move breaking a key swing point.
- Implication: Establishment of a new trend direction.
Now, let's quickly summarise:
- Break of Structure: Continues the current trend by establishing new highs in an uptrend or new lows in a downtrend, confirming the trend’s strength.
- Change of Character: Hints at a trend reversal by breaking a significant swing point in the opposite direction of the prevailing trend.
- Market Structure Shift: Confirms a trend reversal with a strong impulse move that breaks a key swing point, signaling the start of a new trend.
Market Structure Shift vs. Liquidity Grab
It’s crucial to distinguish between a genuine market structure shift and a liquidity grab, which is a temporary price movement designed to trigger stop losses and collect liquidity.
Market Structure Shift
A market structure shift occurs when there is a fundamental change in the trend.
For example, in an uptrend, if the price starts making lower highs and lower lows consistently, it indicates a shift to a downtrend.
This shift is usually accompanied by a change in market sentiment and sustained price movements in the new direction.
Liquidity Grab
A liquidity grab, on the other hand, is a short-term price spike designed to trigger stop losses placed by traders.
For instance, in an uptrend, the price might briefly drop below a recent higher low to trigger stop losses before continuing higher.
These moves are often short-lived and do not indicate a genuine change in market structure.
Understanding market structure is like having a roadmap in the trading world.
It is a basis for the TradeLean Strategy and the very first thing I try understand for any asset class.
Keep practicing these concepts on your charts, and soon enough, you’ll develop a keen eye for market structure that will significantly enhance your trading performance.
Summary
Market structure is the cornerstone of any trading strategy, and the TradeLean Strategy is no different.
This understanding goes beyond simple buy or sell decisions; it involves grasping the underlying market cycles and phases that drive price movements.
This knowledge empowers traders to anticipate market changes, make informed decisions, and improve overall trading performance.
By recognizing and analyzing the four primary market cycle phases—accumulation, mark-up, distribution, and mark-down—traders can better align their strategies with the current market stage.
This alignment is crucial for taking advantage of market opportunities and mitigating risks.
Patience and discipline are essential when interpreting market structures.
Patterns take time to form, reflecting the collective actions of market participants.
Rushing to act on incomplete formations can lead to premature and costly decisions.
Seasoned traders understand the importance of waiting for clear confirmation signals before making trades.
Additionally, understanding the distinctions between Break of Structure (BOS), Change of Character (ChoCh), and Market Structure Shift (MSS) helps traders navigate transitions effectively, avoiding pitfalls like false breakouts or liquidity grabs.
Incorporating market structure analysis into your trading approach enhances your ability to navigate the markets successfully.
Whether you are a novice or an experienced trader, mastering these concepts will contribute to more effective and profitable trading.
Keep practicing, refining your understanding, and let market structure guide your trading journey to success.