Reading Price from Candlesticks
Understand key candlestick patterns revealing market psychology and helping you anticipate shifts.

Introduction
Trading is as much an art as it is a science, and understanding candlestick patterns is a vital part of mastering this art.
Candlestick charts offer valuable insights into market psychology, allowing traders to gauge the battle between buyers and sellers.
But with hundreds of candlestick types out there, it's easy to get overwhelmed.
Fear not!
In this post, we'll distill the essential candlesticks types you need to know, weaving in the TradeLean philosophy focused on simplicity to help you make informed decisions resulting in profitable trades.
What is a Candlestick?
A candlestick is a graphical representation of an asset’s price movement within a specified time period.
Candlestick charts are a cornerstone of technical analysis, enabling traders to quickly interpret price information and make informed decisions.

Each candlestick has three basic features:
- The Body: Represents the range between the opening and closing prices.
- The Wick (or Shadow): Indicates the intra-day high and low prices.
- The Color: Reveals the direction of market movement—green (or white) for price increases, red (or black) for price decreases.
Over time, individual candlesticks form patterns that traders use to recognize major support and resistance levels.
These patterns provide insights into the balance between buying and selling pressures, continuation trends, or market indecision.
Candlestick Types
Candlesticks are the heartbeat of trading charts.
They tell the story of price action in a visual format, highlighting who is in control—buyers or sellers.
While it might take a long time to recognise and memorize every candlestick and pattern, what's more crucial is understanding the context and the message each candle conveys.
Personally, I focus on the essence of candlesticks, enabling you to read the market effectively without getting bogged down by nomenclature.
I categorise candlesticks into two primary types: indecisive candles and solid candles.
This distinction helps streamline your analysis and sharpen your trading.
Indecisive Candles
Indecisive candles are often the first sign that the market is about to make a significant move.
Recognizing these candles can help you prepare for upcoming market shifts.
They signal that neither buyers nor sellers have the upper hand, and the market is in a state of equilibrium.
The two most common indecisive candles you'll encounter are Doji candles and Inside Bar candles.
Doji Candle
Doji candles are characterized by their small bodies and long wicks, indicating a tug-of-war between buyers and sellers.
There are various types of Doji candles, but they all share the same essence: market indecision.
A Doji represents a slowdown in price movement and often precedes a potential reversal.
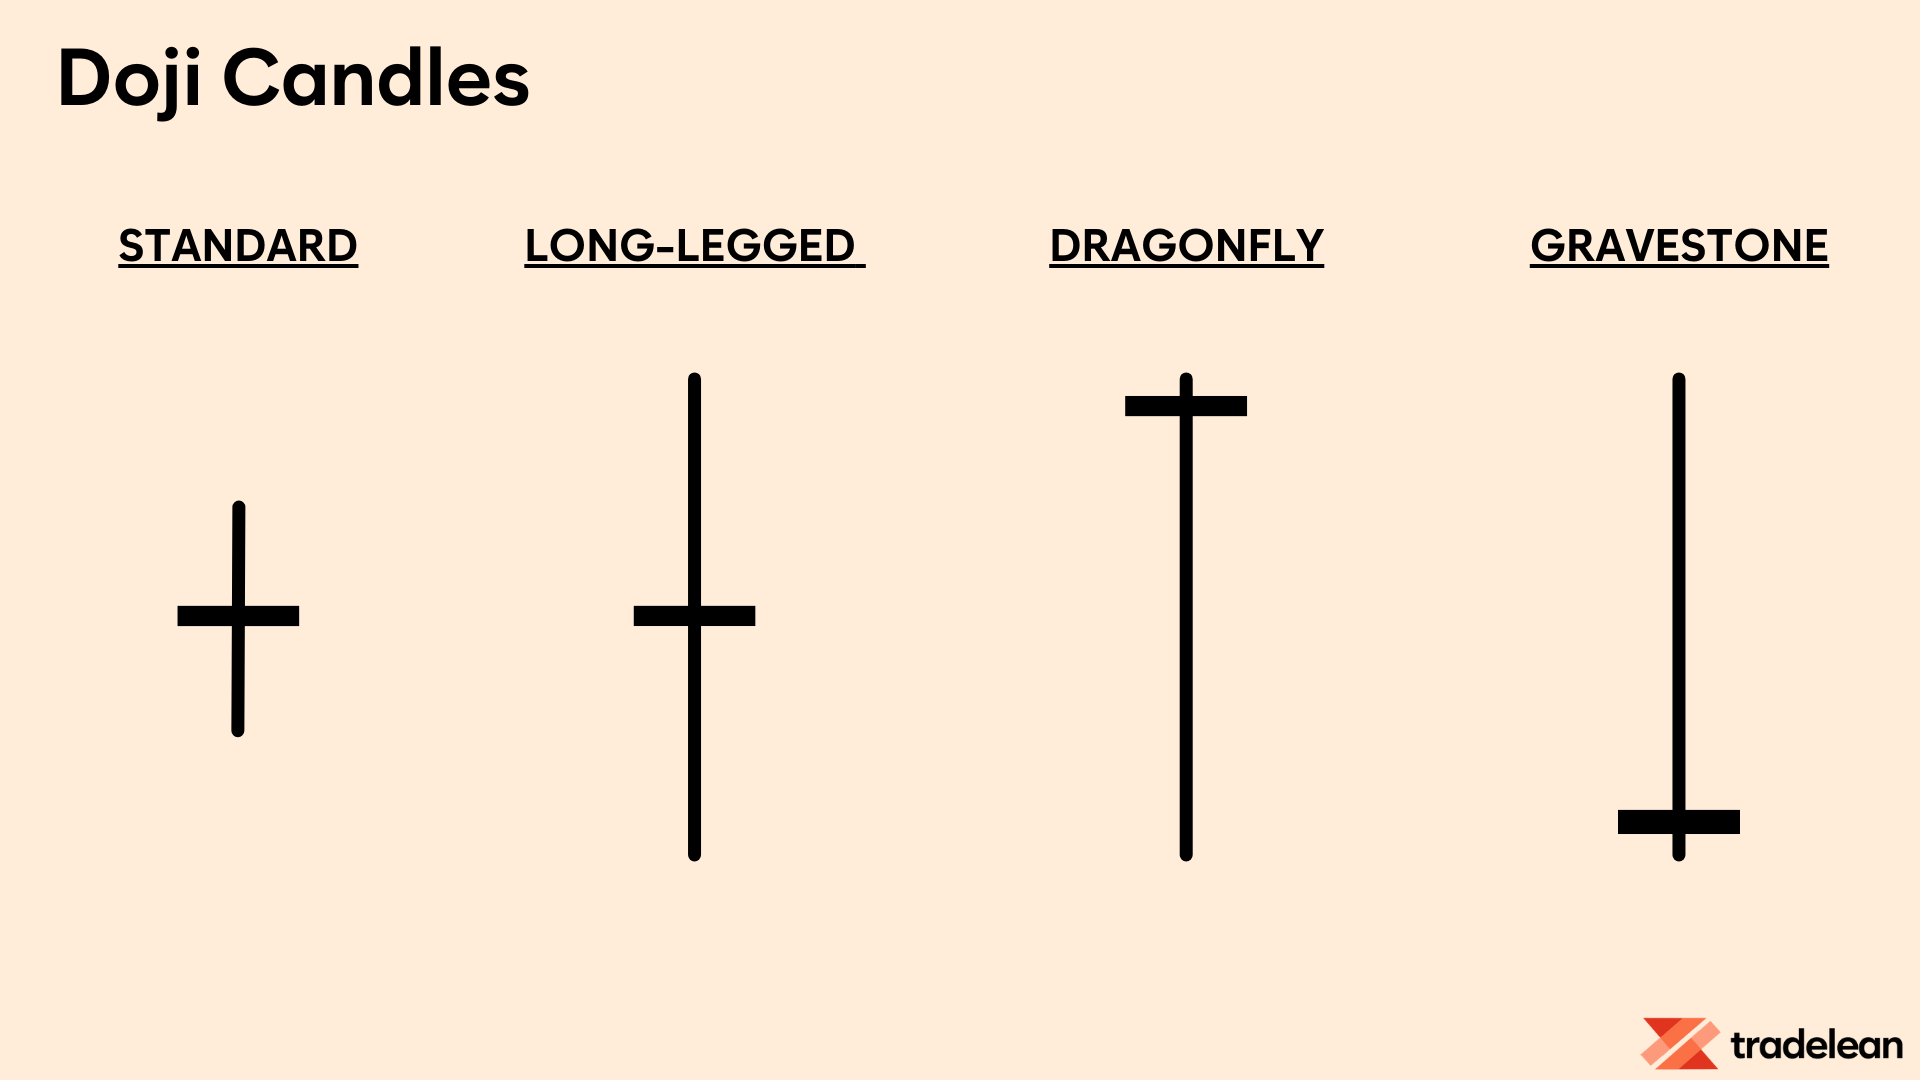
Key variations include:
- Standard Doji: Equal opening and closing prices.
- Long-Legged Doji: Longer wicks, indicating increased volatility.
- Dragonfly Doji: A long lower wick with no upper wick, signaling potential bullish reversal.
- Gravestone Doji: A long upper wick with no lower wick, signaling potential bearish reversal.
When you spot a Doji after a strong bullish or bearish trend, it's a sign that the trend might be losing steam.
However, a single Doji isn't enough to make a trading decision. Wait for the next candle to confirm the direction.
Inside Bar Candle
An Inside Bar is a smaller candle that forms within the high and low range of the previous candle, known as the "mother candle."
Inside Bars are common and can be highly profitable if traded correctly.
These candles indicate consolidation and potential breakout points. The key is to watch for a breakout from the mother candle's range.
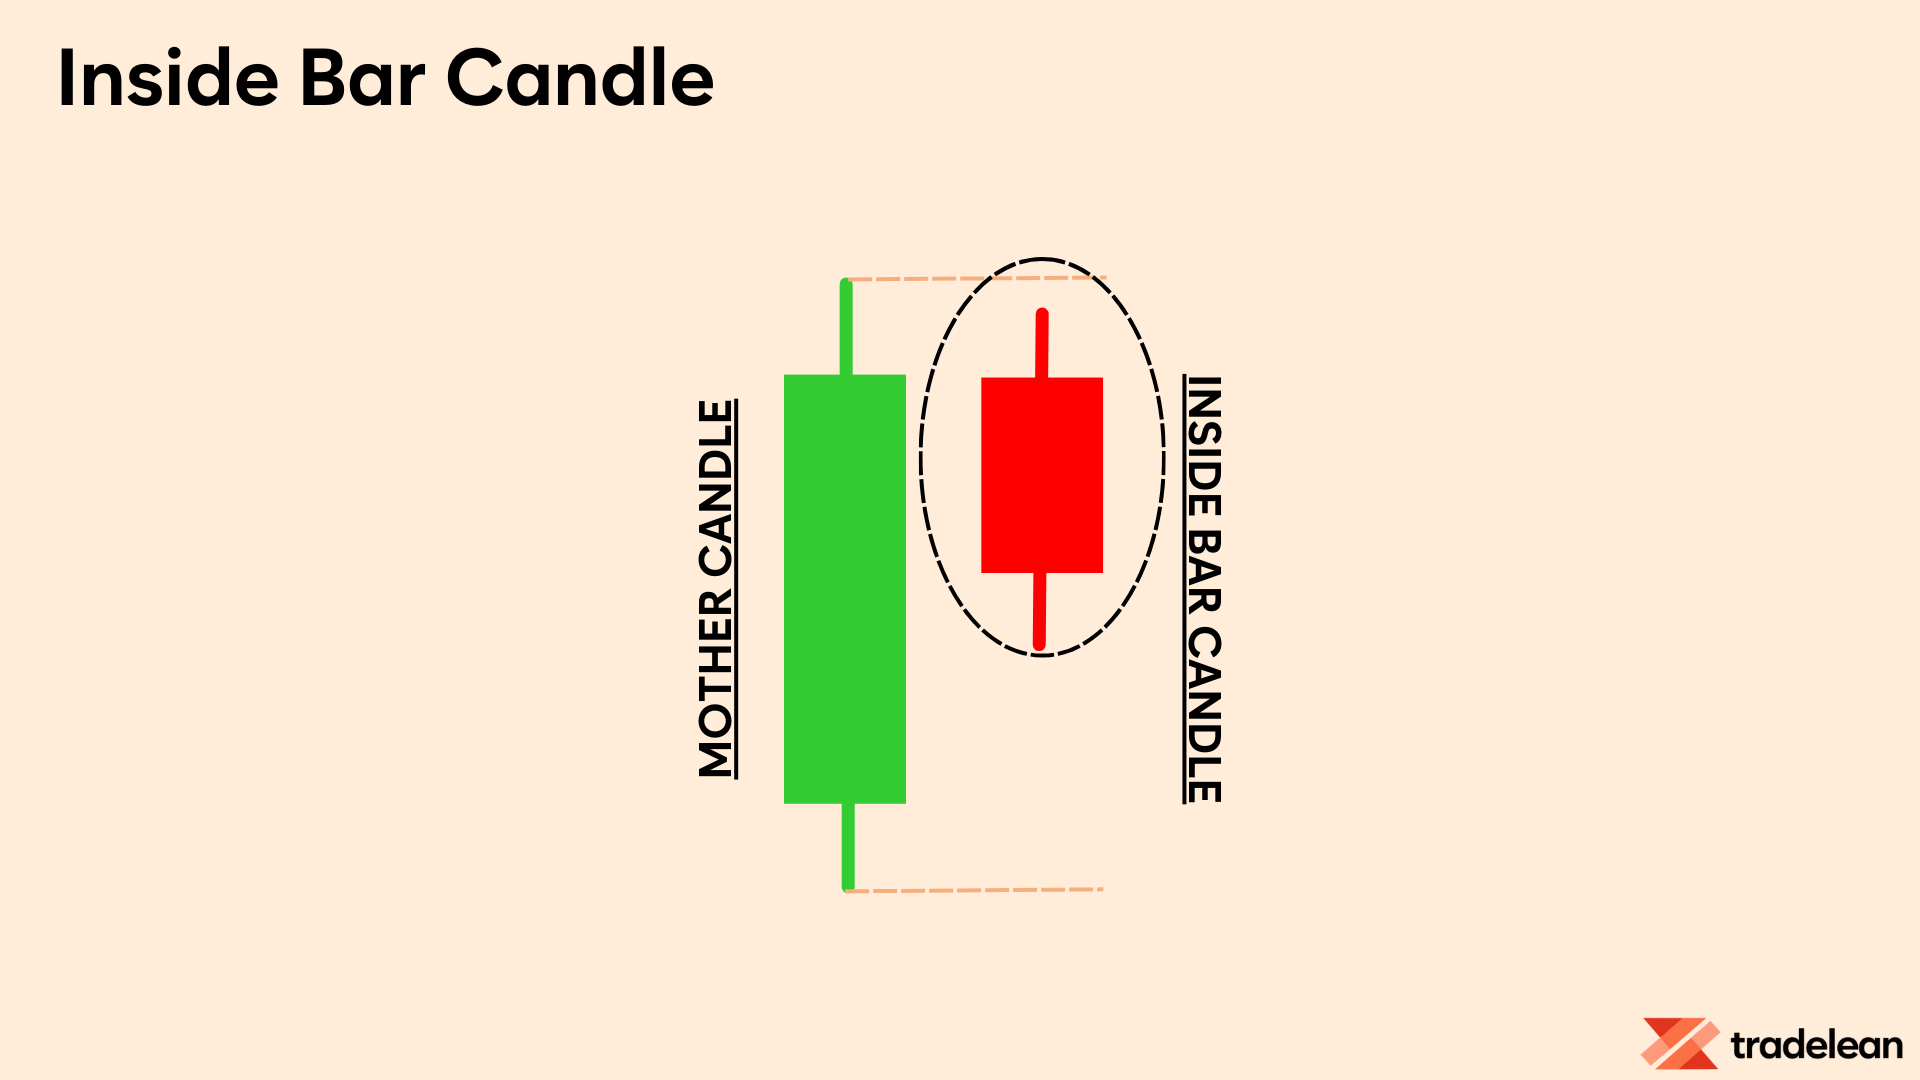
Key characteristics of Inside Bart candle include:
- The high and low of the Inside Bar are within the high and low of the previous candle.
- The closing price of the Inside Bar is less important than its overall size.
Inside Bars indicate consolidation and a potential breakout.
Wait for the next candle to break out of the Inside Bar's range to confirm the direction.
How to Trade Indecisive Candles?
There is a section in this TradeLean Toolkit that will focus on the TardeLean Strategy definition and Strategy execution.
However, here I would like to share with you initial insights into how to deal with indecisive candles.
Doji Candlestick: When you spot a Doji candle, wait for the next candle to confirm the market direction. If a Doji appears at a TradeLean resistance after a bullish trend and the next candle is bearish, it could signal a reversal. Conversely, if the next candle is bullish, the trend may continue.
Inside Bar Candlestick: Inside Bar candles often signal consolidation before a breakout. When an Inside Bar forms, place a buy order above the high and a sell order below the low of the mother candle. The breakout direction will determine your trade.
Solid Candles and Their Significance
Solid candles are those that show clear market direction.
They indicate that either buyers or sellers have taken control, and the market is moving decisively in one direction.
The main types of solid candles relevant in the context of the TradeLean Strategy include Engulfing Candles, Pin Bars, Hammers, Hanging Men, and Shooting Stars.
These candles are especially significant when they appear at TradeLean Support or Resistance!
Engulfing Candle
Engulfing Candles show a complete reversal of the previous candle's direction.
A bullish engulfing pattern after a downtrend signals a strong buying interest, while a bearish engulfing pattern after an uptrend signals strong selling interest.
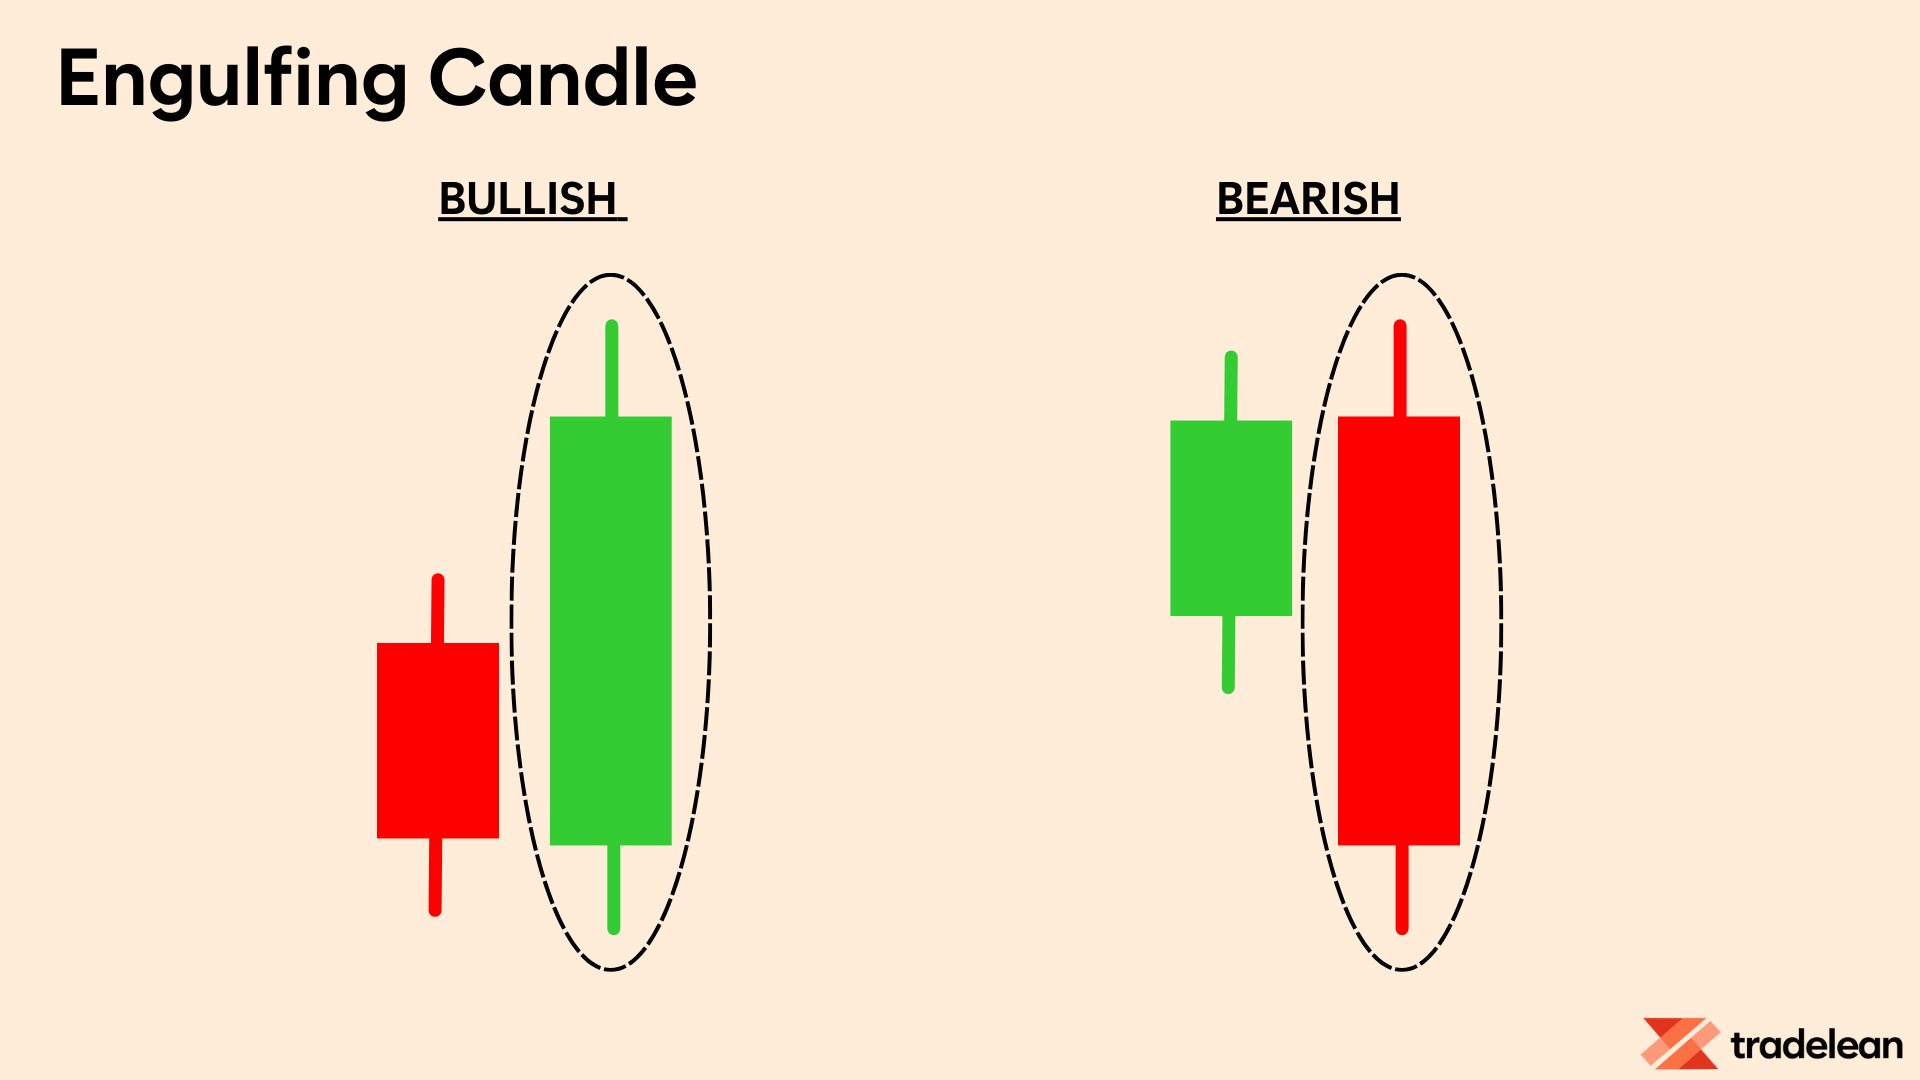
Key Characteristics:
- The engulfing candle's body is larger and completely covers the previous candle.
- Indicates a strong reversal when it forms at key support or resistance levels.
Pin Bar Candle
The Pin Bars indicate a strong rejection of a price level.
The longer the tail, the stronger the signal.
A bullish Pin Bar with a long lower wick suggests strong buying interest at lower prices.
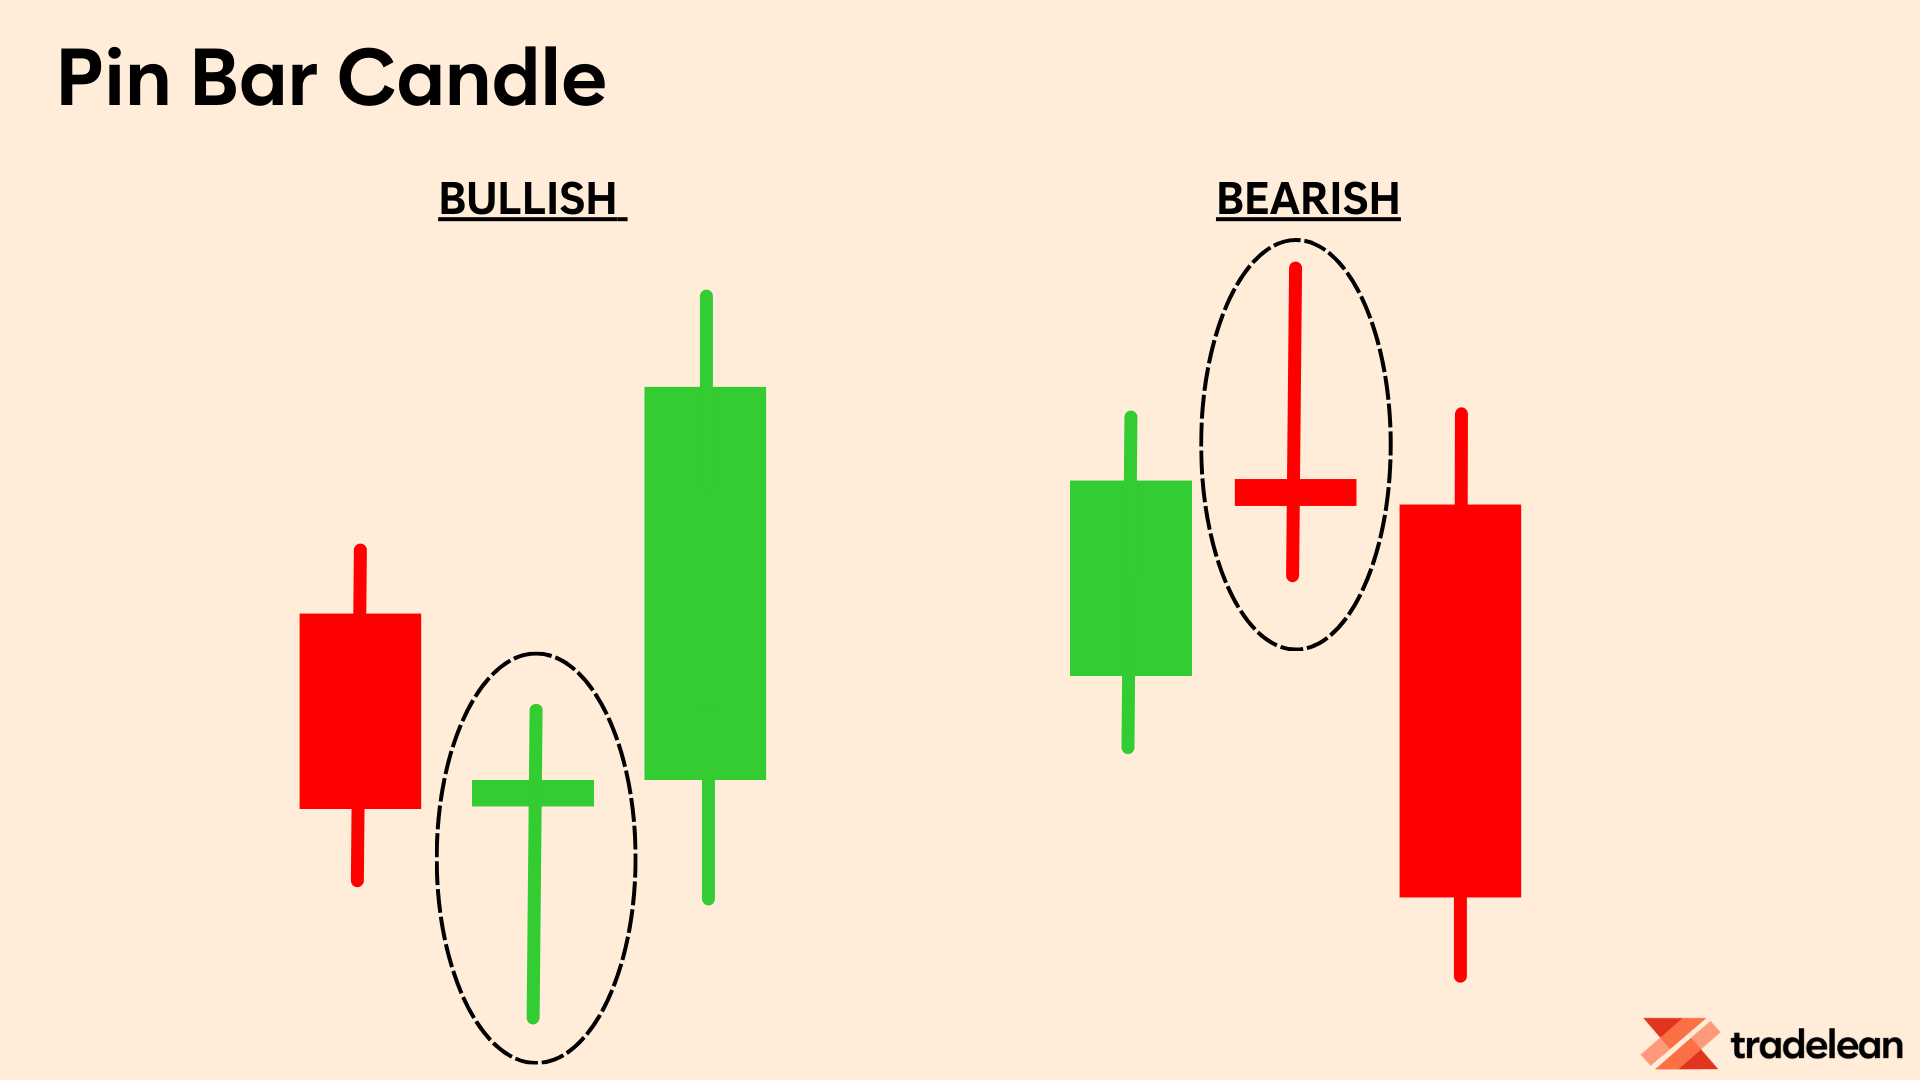
Key Characteristics:
- Long wick (tail) with a small body.
- The direction is opposite to the tail. A long lower tail indicates bullishness, while a long upper tail indicates bearishness.
Hammer and Hanging Man Candles
These candlesticks indicate potential reversals based on their location.
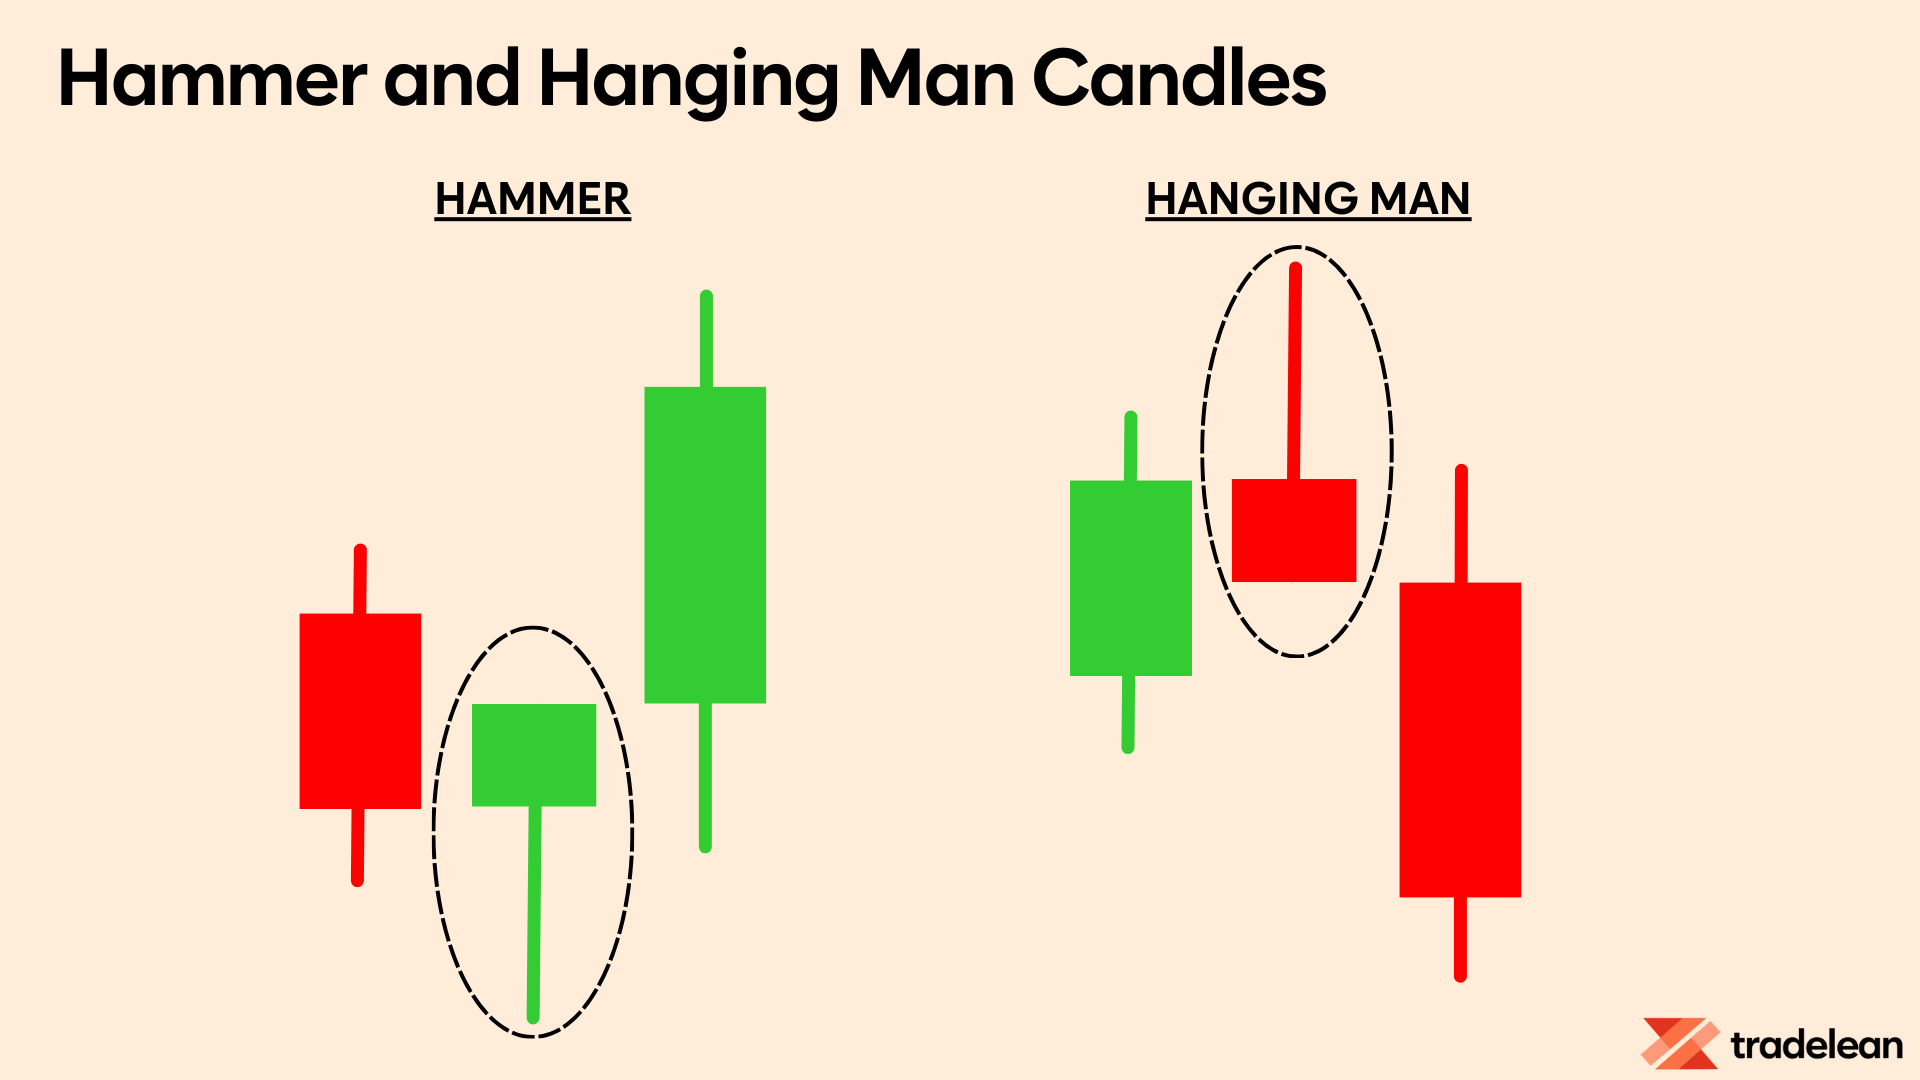
Hammer and Hanging Man
- (Inverse) Hammer: Bullish reversal at support.
- Hanging Man: Bearish reversal at resistance.
These candlesticks are smaller than Pin Bars but still significant when they appear at key levels.
Breakouts, Rejections, and Fakeouts
Understanding breakouts and rejections is crucial for making informed trading decisions.
A breakout occurs when the price moves decisively through a support or resistance level, while a rejection happens when the price fails to break through and reverses direction.
Breakout and Rejecion
Single Candle: In some cases, a single strong candle can signal a breakout or a rejection. This is especially true for powerful patterns like Pin Bars and Engulfing Candles.
Multiple Candles: For a more conservative approach, I wait for two consecutive candle closures in the breakout or rejection direction. This helps confirm it and reduce the risk of a fakeout.
Fakeout
Fakeouts occur when the price briefly breaks a level only to reverse.
To avoid getting trapped, look for additional confirmation.
If the breakout candle is quickly followed by a candle closing in the opposite direction, it's likely a fakeout.
Other Candlestick Patterns
Above I covered the most important candlesticks that are more than sufficient for you to know to master your trading!
Below I would like to bring to your attention several patterns that is good to know rather than must know.
Understanding and recognising this patterns will come with experience!
Similar to the candlestick types, the patterns are very important when they appear at TradeLean Support or Resistance.
Bullish Candlestick Patterns
Bullish patterns typically emerge after a market downtrend and suggest a reversal in price movement.
They signal traders to consider opening long positions to capitalize on an upward trajectory.
Piercing Line
The piercing line is a two-candle pattern, consisting of a long red candle followed by a long green candle.
There is usually a significant gap down between the first candle's closing price and the green candle's opening.
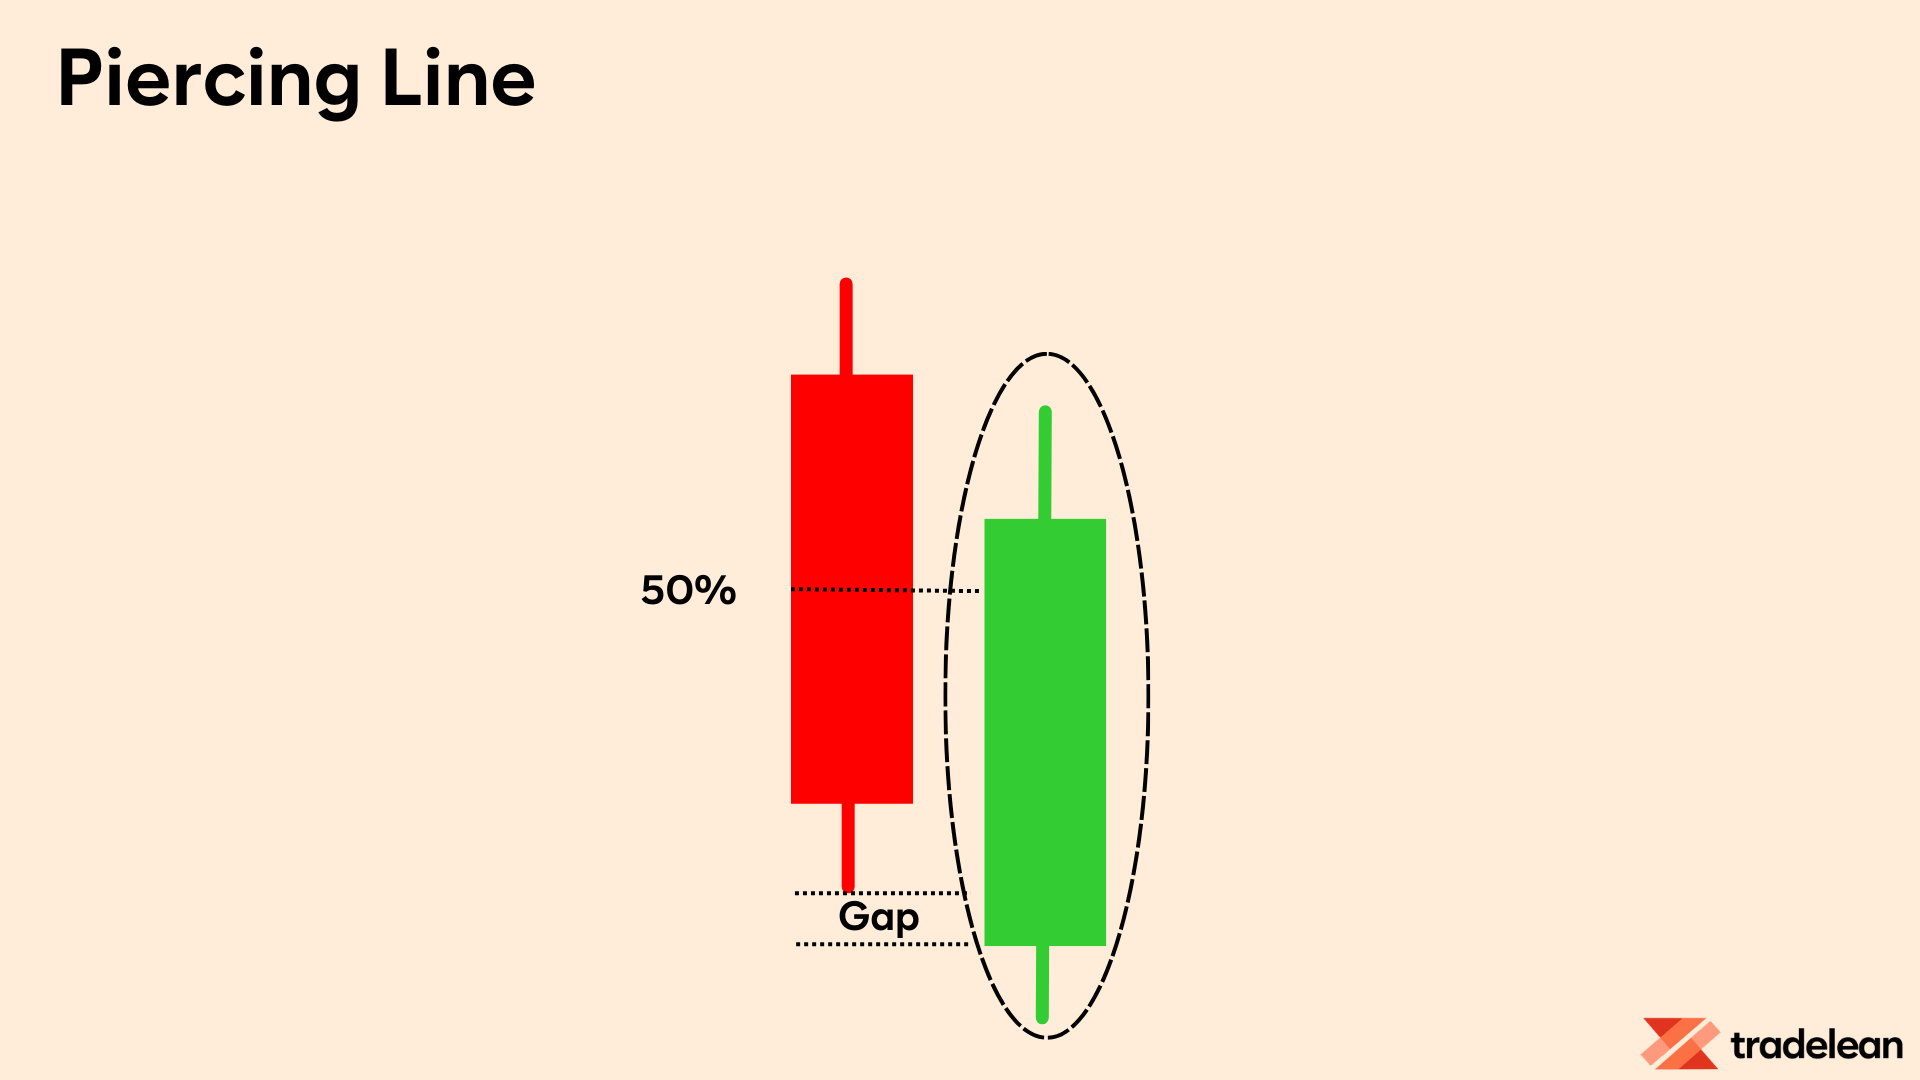
Also, the closure of the second candle is typically above or below 50% of the first candle body.
This pattern shows strong buying pressure, pushing the price up to or above the midpoint of the previous day.
Morning Star
The morning star is a three-candle pattern that signals a bullish reversal.
It consists of a long red candle, a short-bodied candle (the star), and a long green candle.
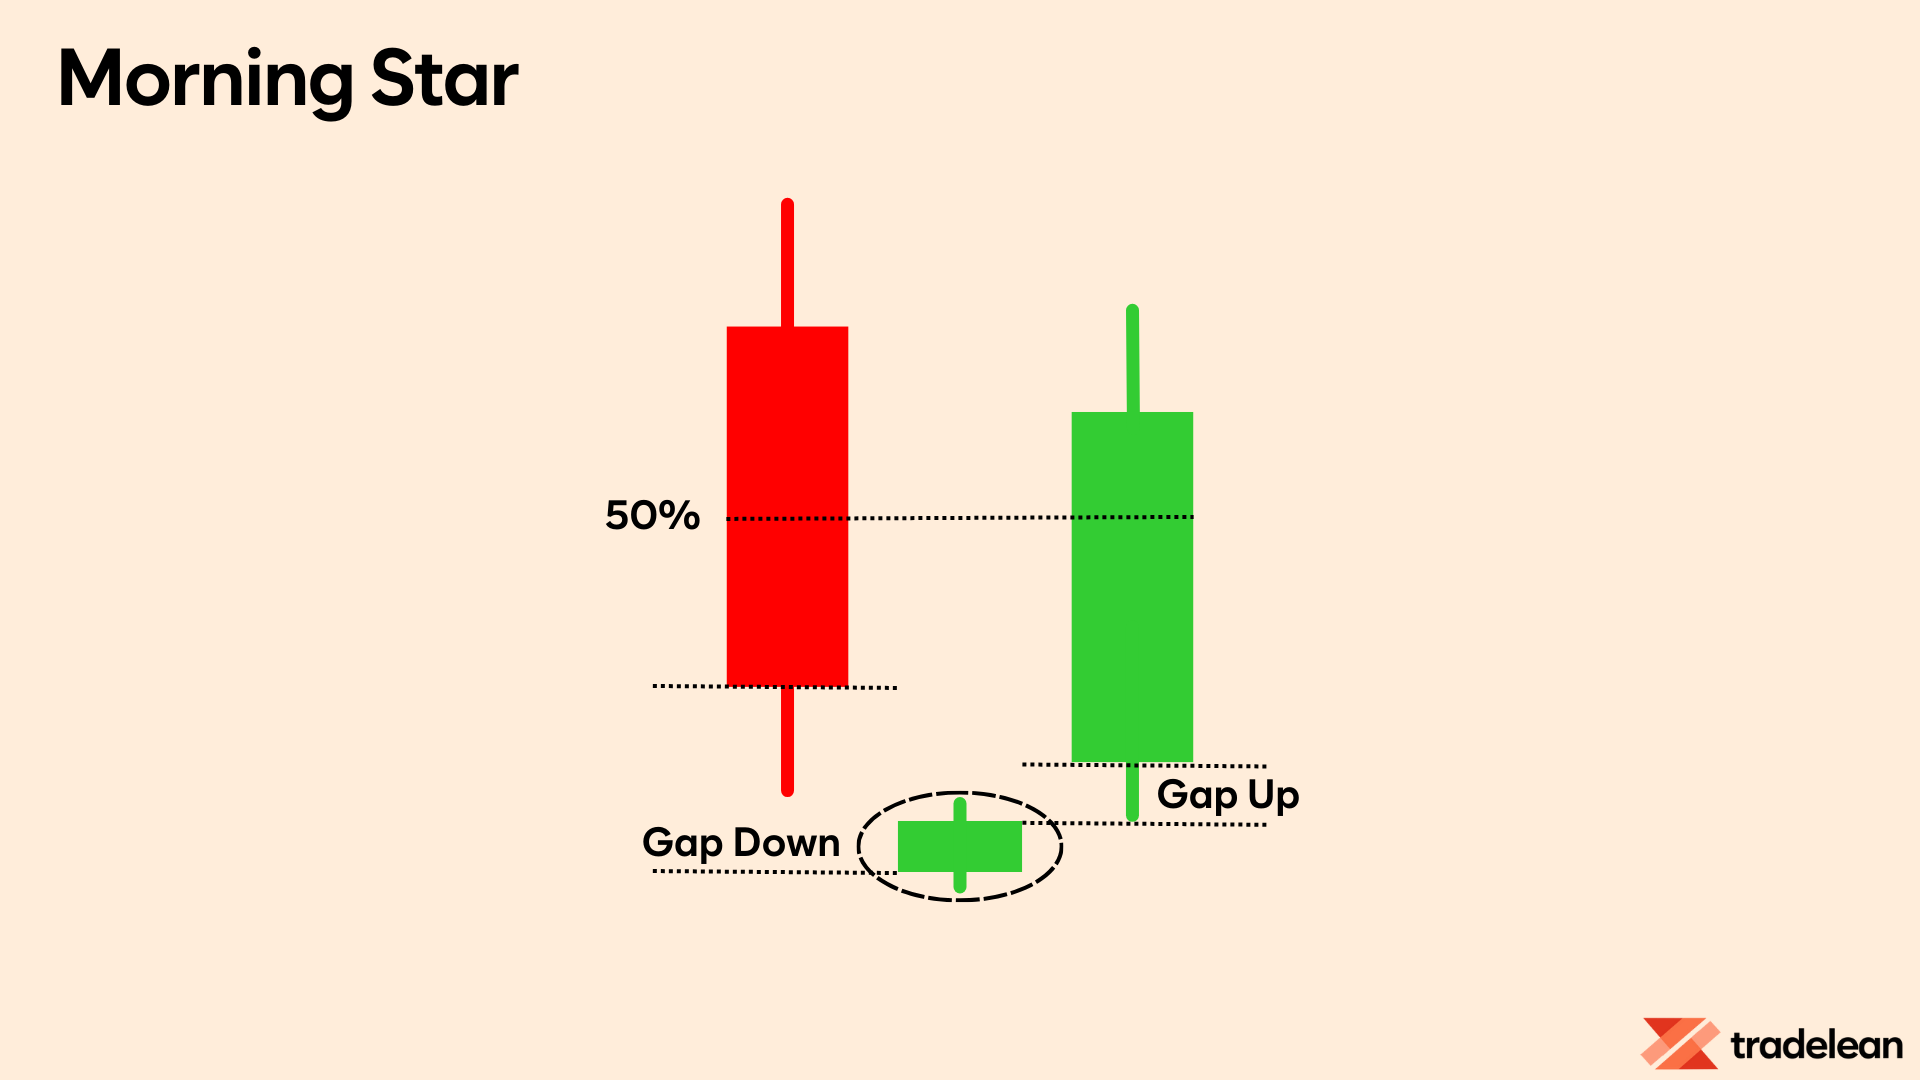
The star typically does not overlap with the longer bodies, indicating a market gap.
Also here, the closure of the third candle is typically above or below 50% of the first candle body.
This pattern suggests that selling pressure is subsiding, and a bullish market is on the horizon.
Three White Soldiers
The three white soldiers pattern appears over three consecutive candles and is a very strong bullish signal.
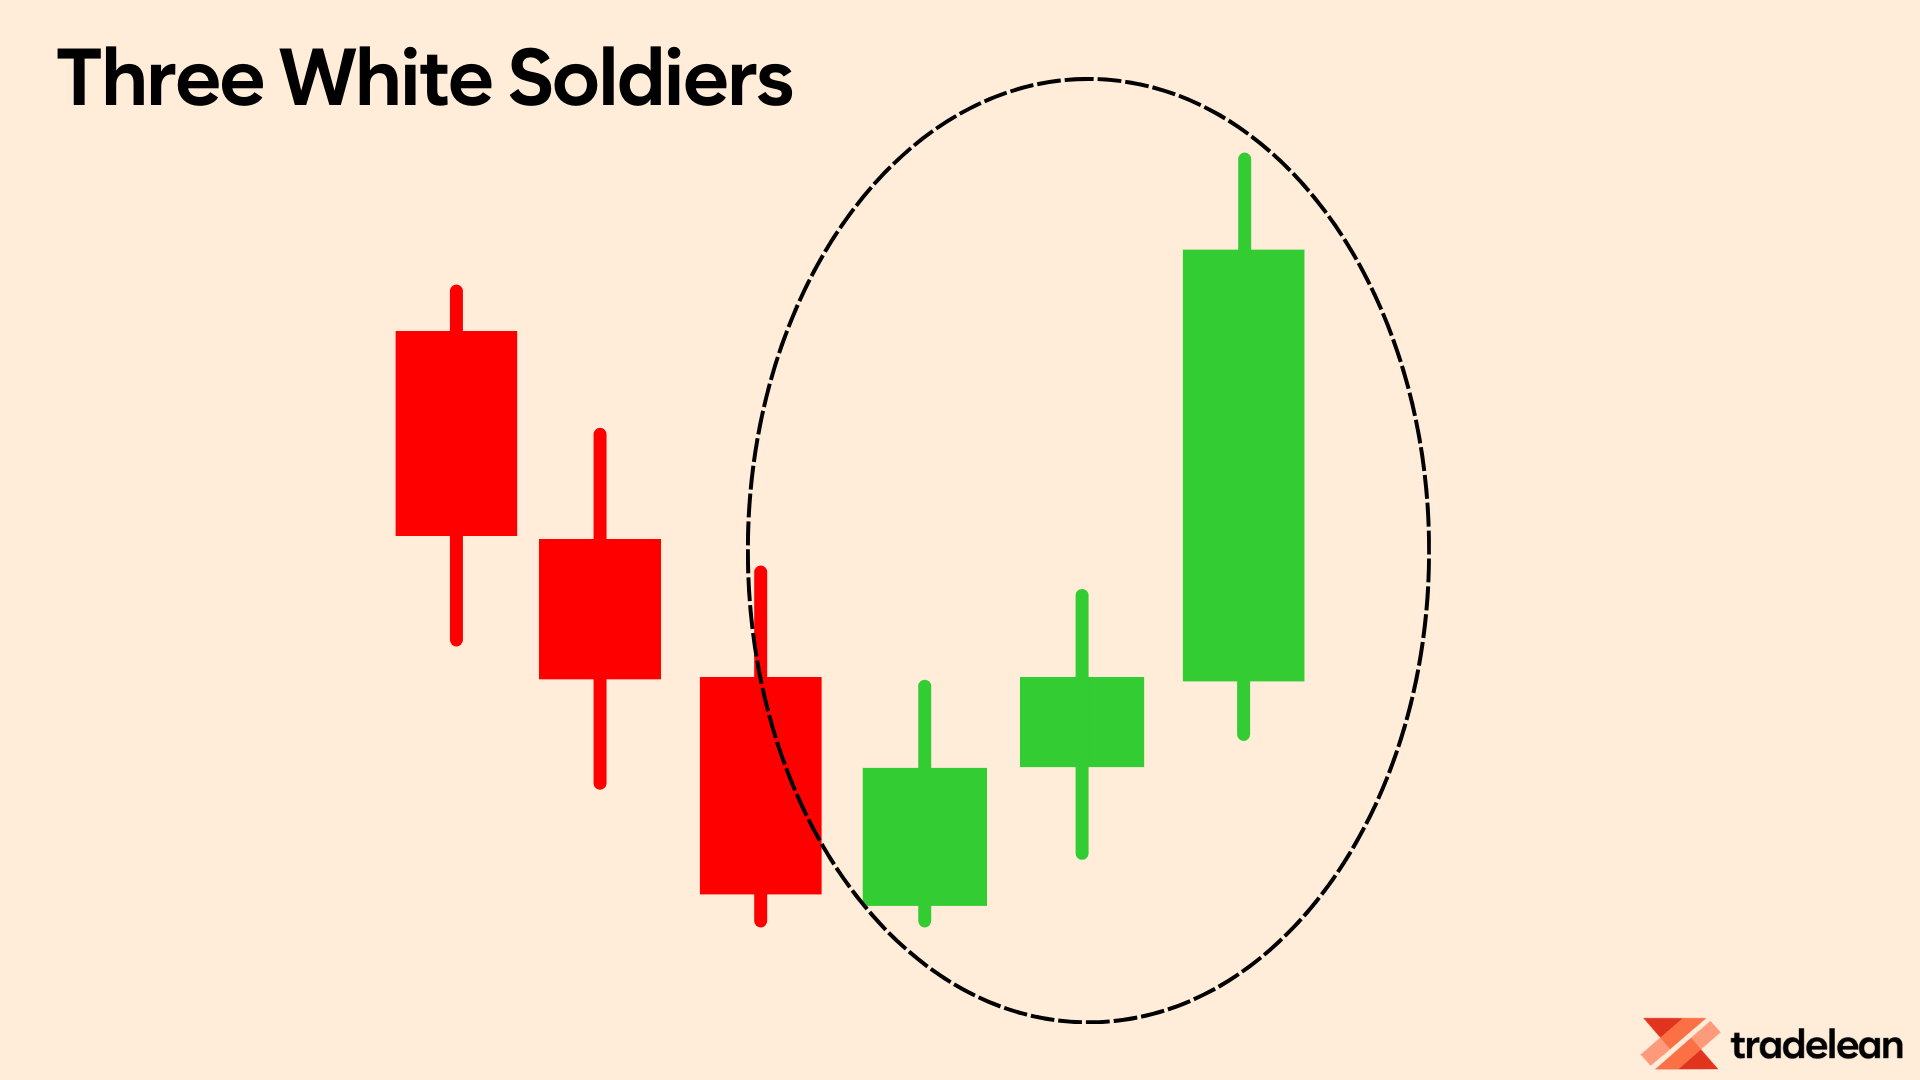
It consists of three long green candles with small wicks, each opening and closing progressively higher than the previous day.
This pattern indicates a steady advance of buying pressure after a downtrend.
Bearish Candlestick Patterns
Bearish candlestick patterns typically form after an uptrend and signal a point of resistance.
They often indicate that traders are closing their long positions and opening short positions to take advantage of falling prices.
Shooting Star
The shooting star resembles the inverse hammer but forms in an uptrend.
It has a small lower body and a long upper wick.
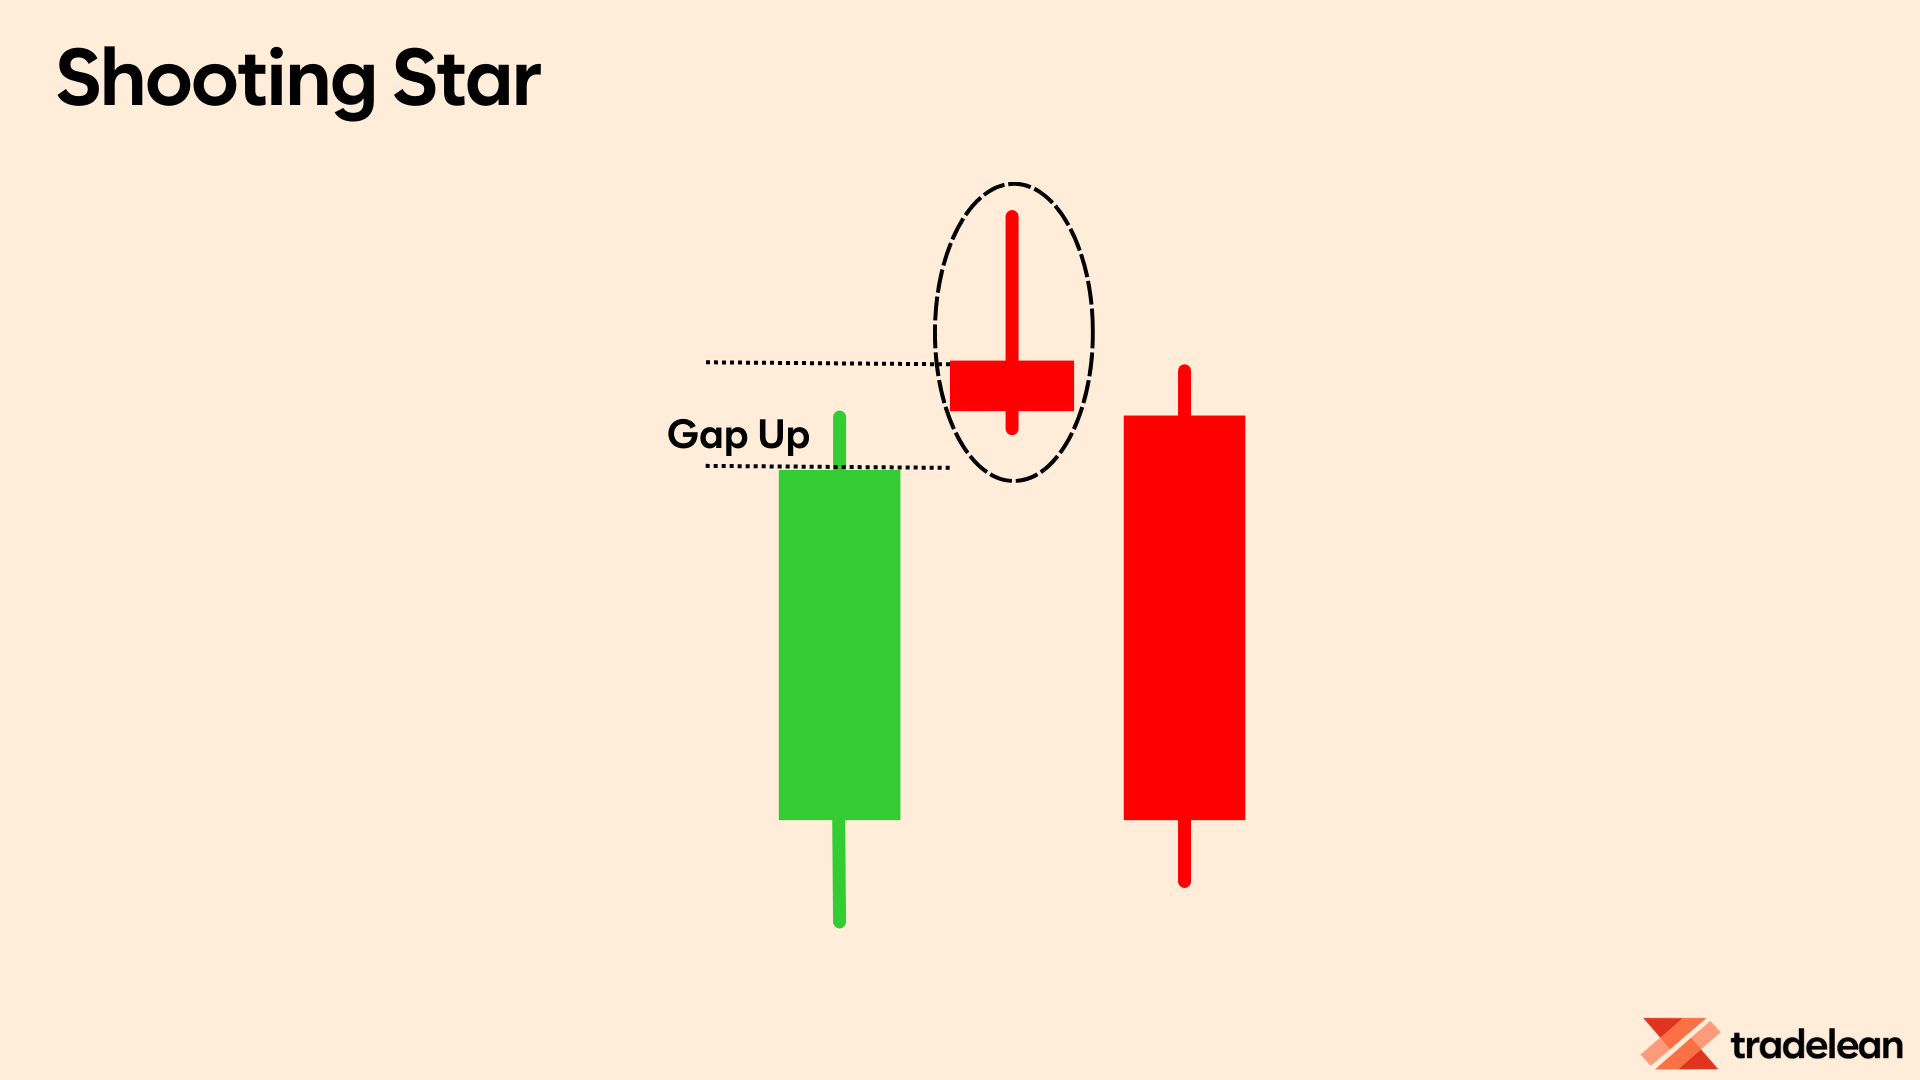
This pattern indicates that the market opened higher, rallied to an intra-day high, but then fell close to the opening price, similar to a star falling to the ground.
Evening Star
The evening star is the bearish counterpart to the morning star.
It consists of a long green candle, a short-bodied candle (the star), and a long red candle.
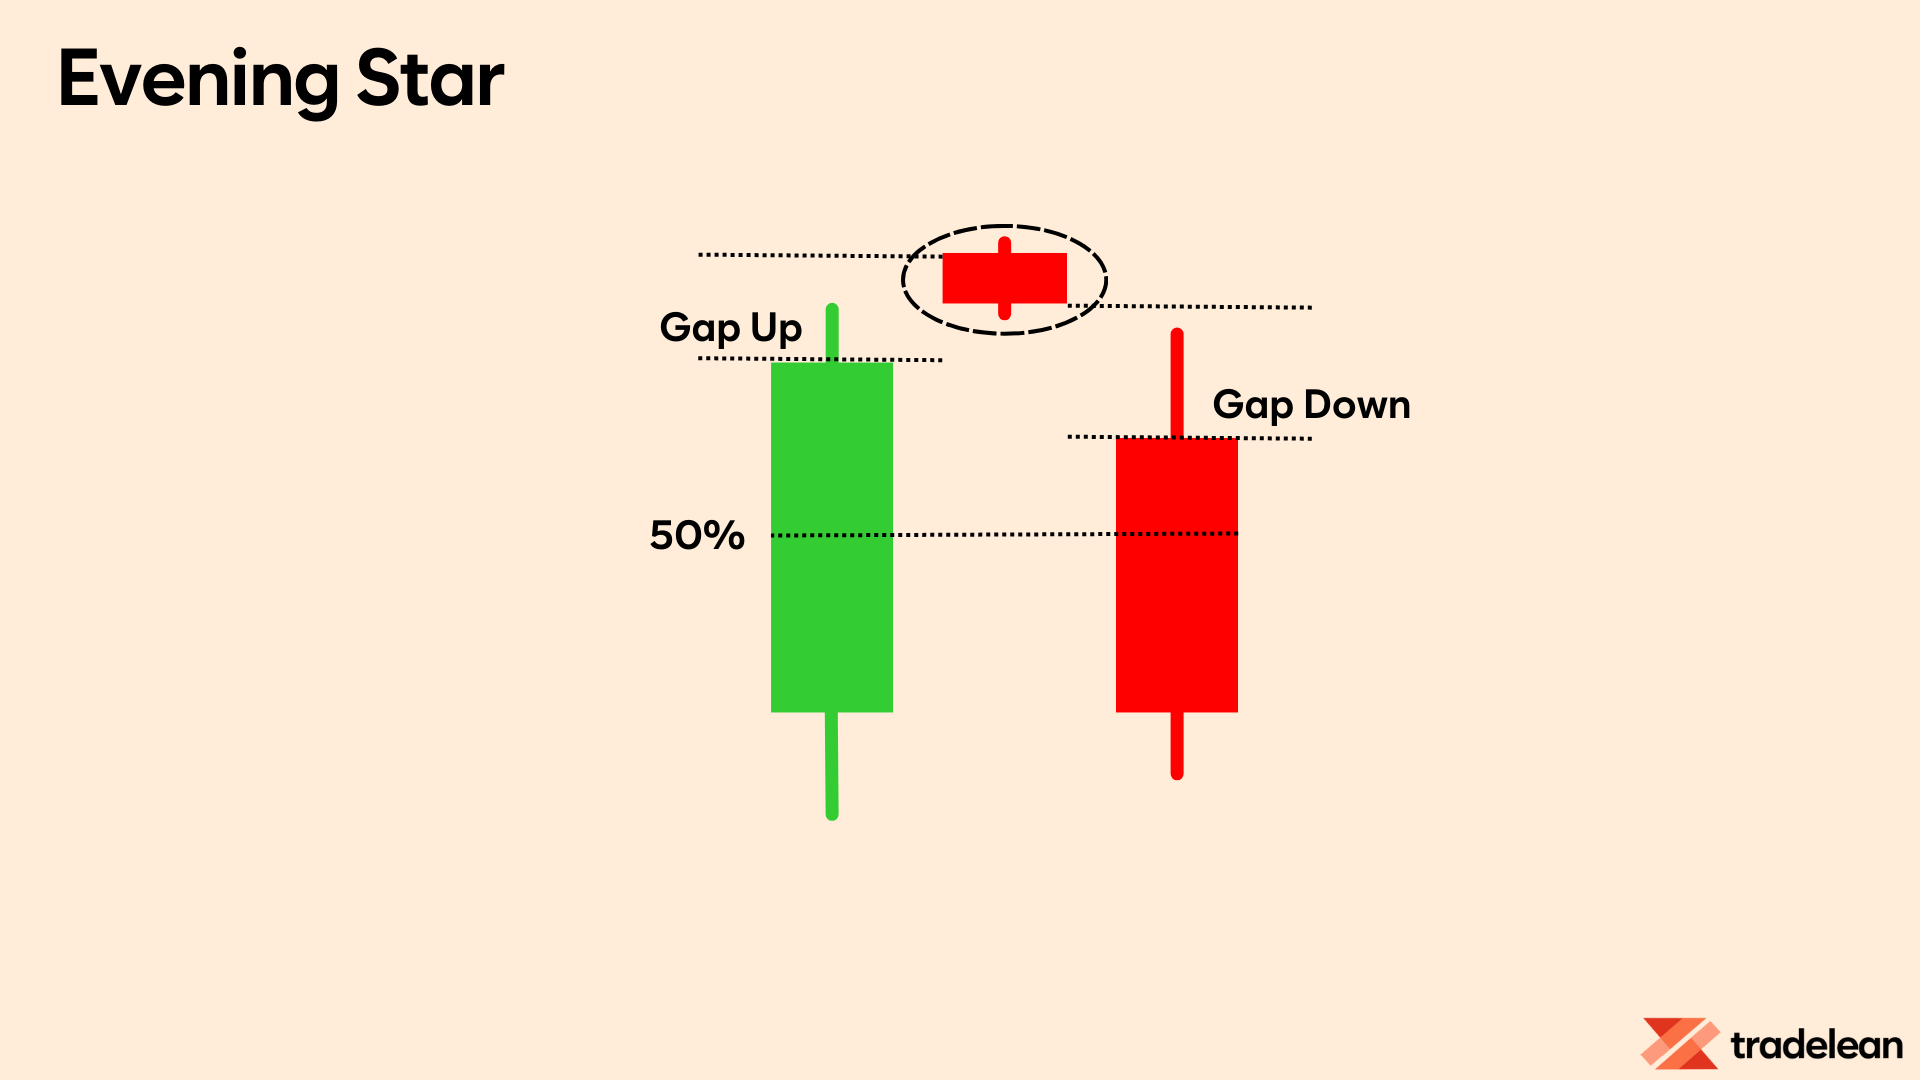
This pattern indicates a reversal of an uptrend and is particularly strong when the third candle erases the gains of the first candle.
Three Black Crows
The three black crows pattern consists of three consecutive long red candles with short or nonexistent wicks.
Each session opens at a similar price to the previous day, but selling pressures push the price lower and lower with each close.
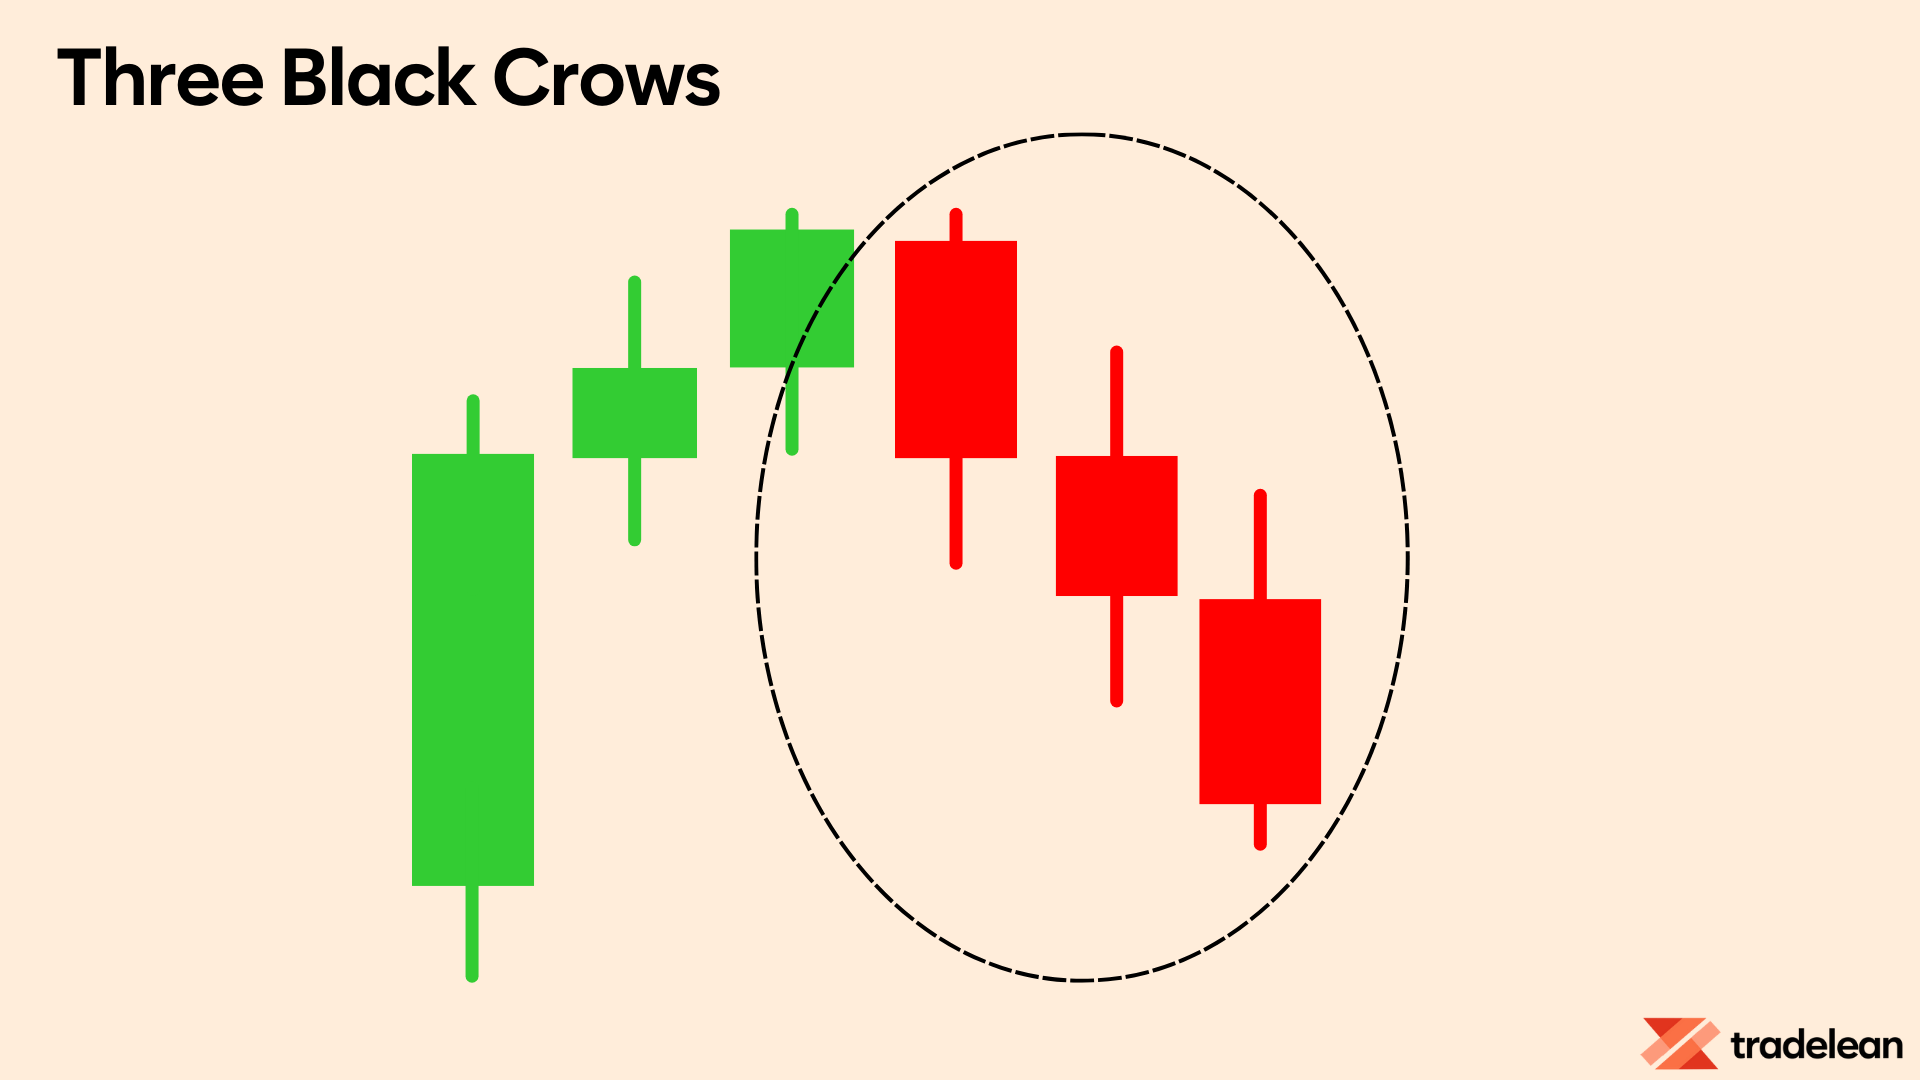
This pattern signals the start of a bearish downtrend as sellers overtake buyers.
Dark Cloud Cover
The dark cloud cover pattern indicates a bearish reversal, symbolizing a black cloud over the previous day’s optimism.
It consists of a red candle that opens above the previous green body but closes below its midpoint.
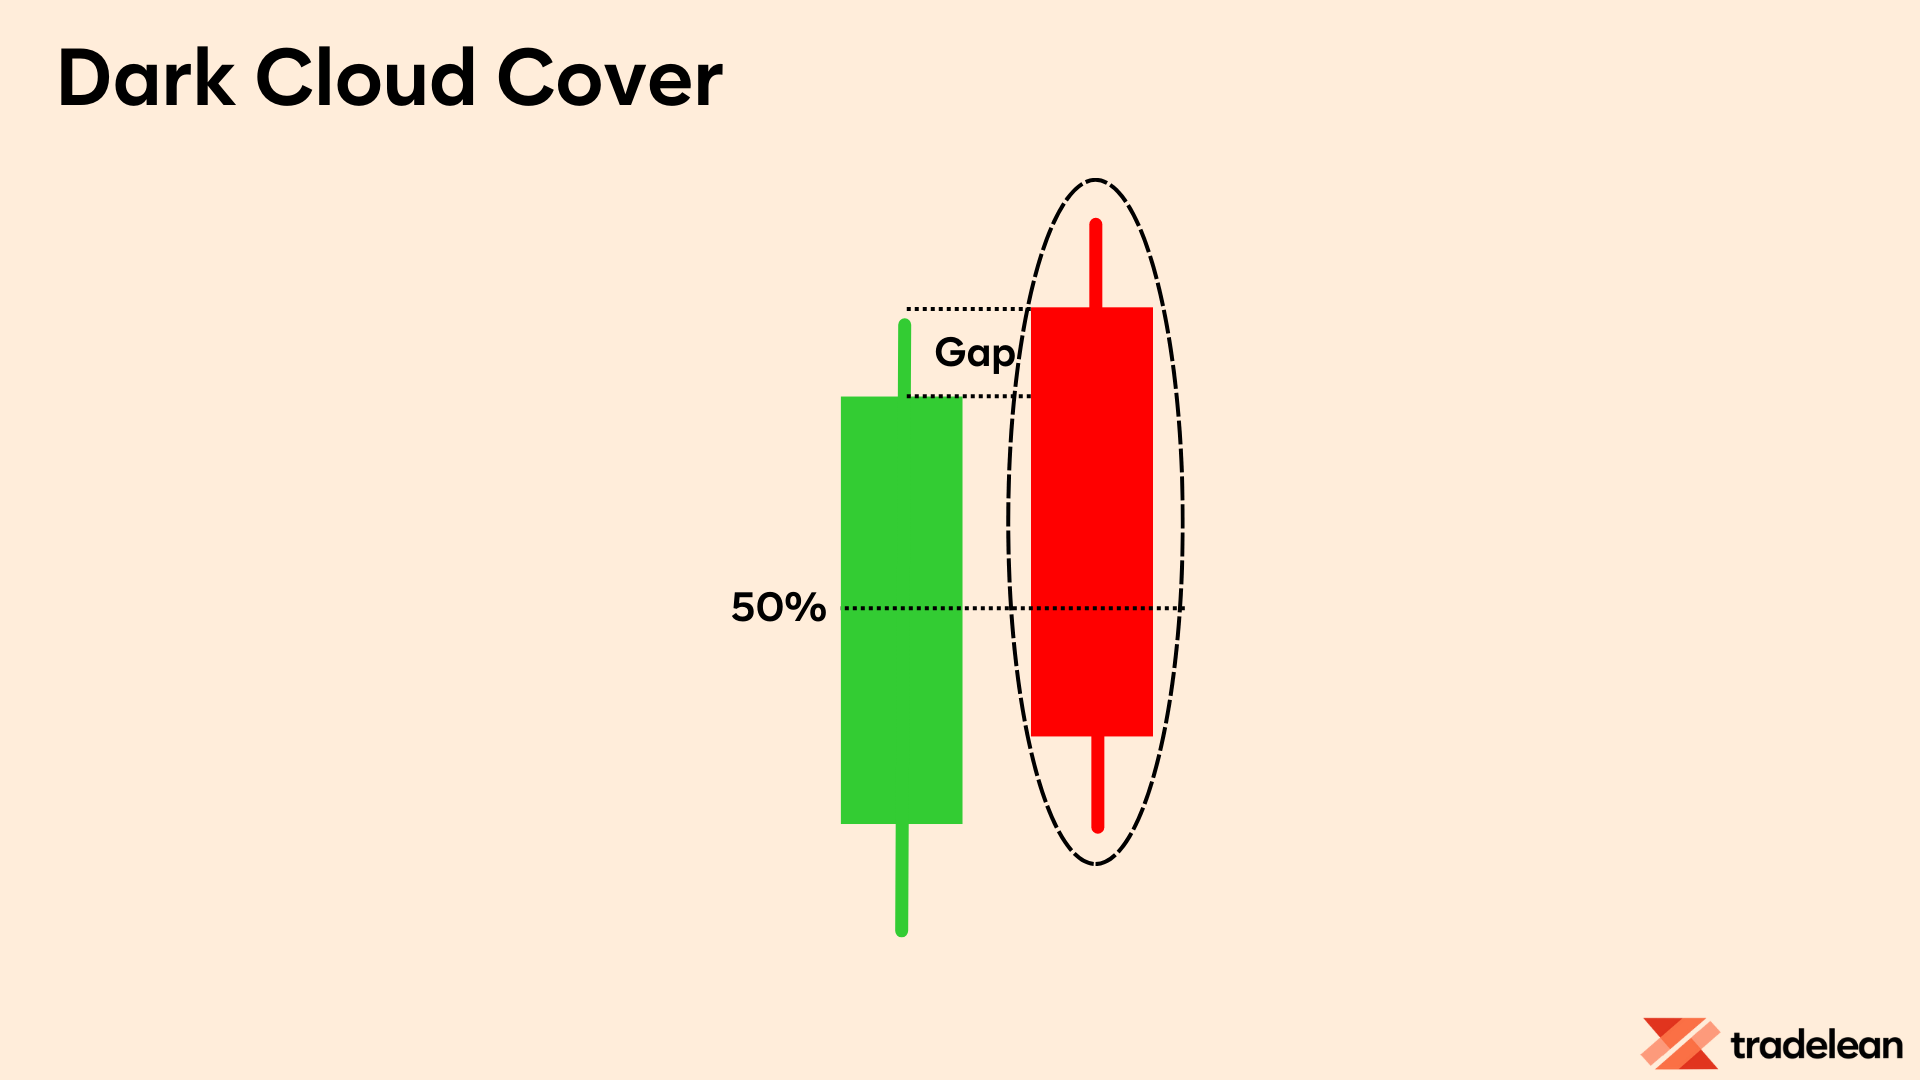
Short wicks suggest a decisive downtrend as bears take over the session.
Continuation Candlestick Patterns
Continuation patterns do not indicate a change in market direction but rather a pause or consolidation within the current trend.
They help traders identify periods of rest in the market when there is indecision or neutral price movement.
Spinning Top
The spinning top candlestick pattern features a short body centered between wicks of equal length, signaling market indecision.
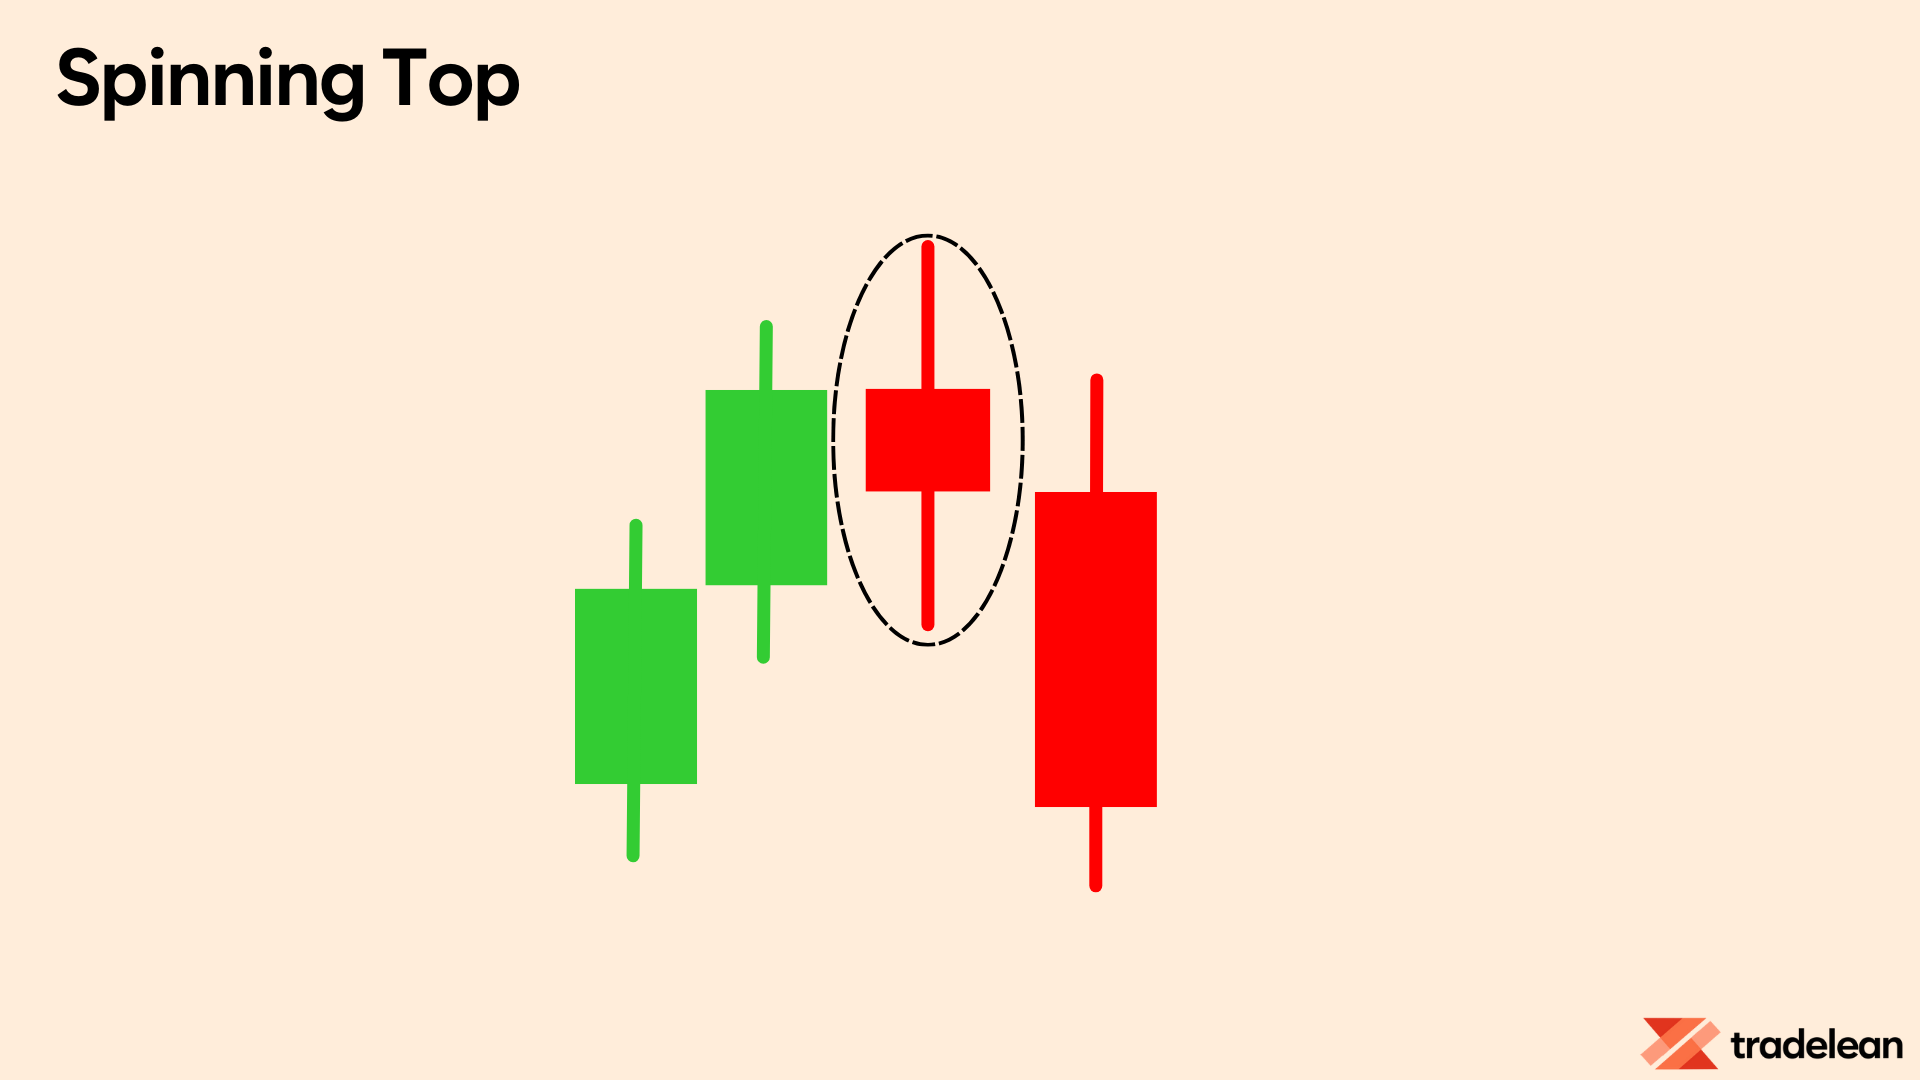
This pattern shows that bulls pushed the price higher and bears drove it lower, resulting in little net change.
Often seen as a period of consolidation or rest after a significant trend, spinning tops suggest that current market momentum is weakening.
While relatively benign on their own, spinning tops can indicate potential changes ahead, highlighting that existing market pressure is diminishing.
Falling Three Methods
The falling three methods is a bearish continuation pattern.

It consists of a long red candle, followed by three small green bodies, and another red candle.
The green candles are contained within the range of the bearish candles, showing that bulls do not have enough strength to reverse the trend.
Rising Three Methods
The rising three methods is the bullish counterpart to the falling three methods.
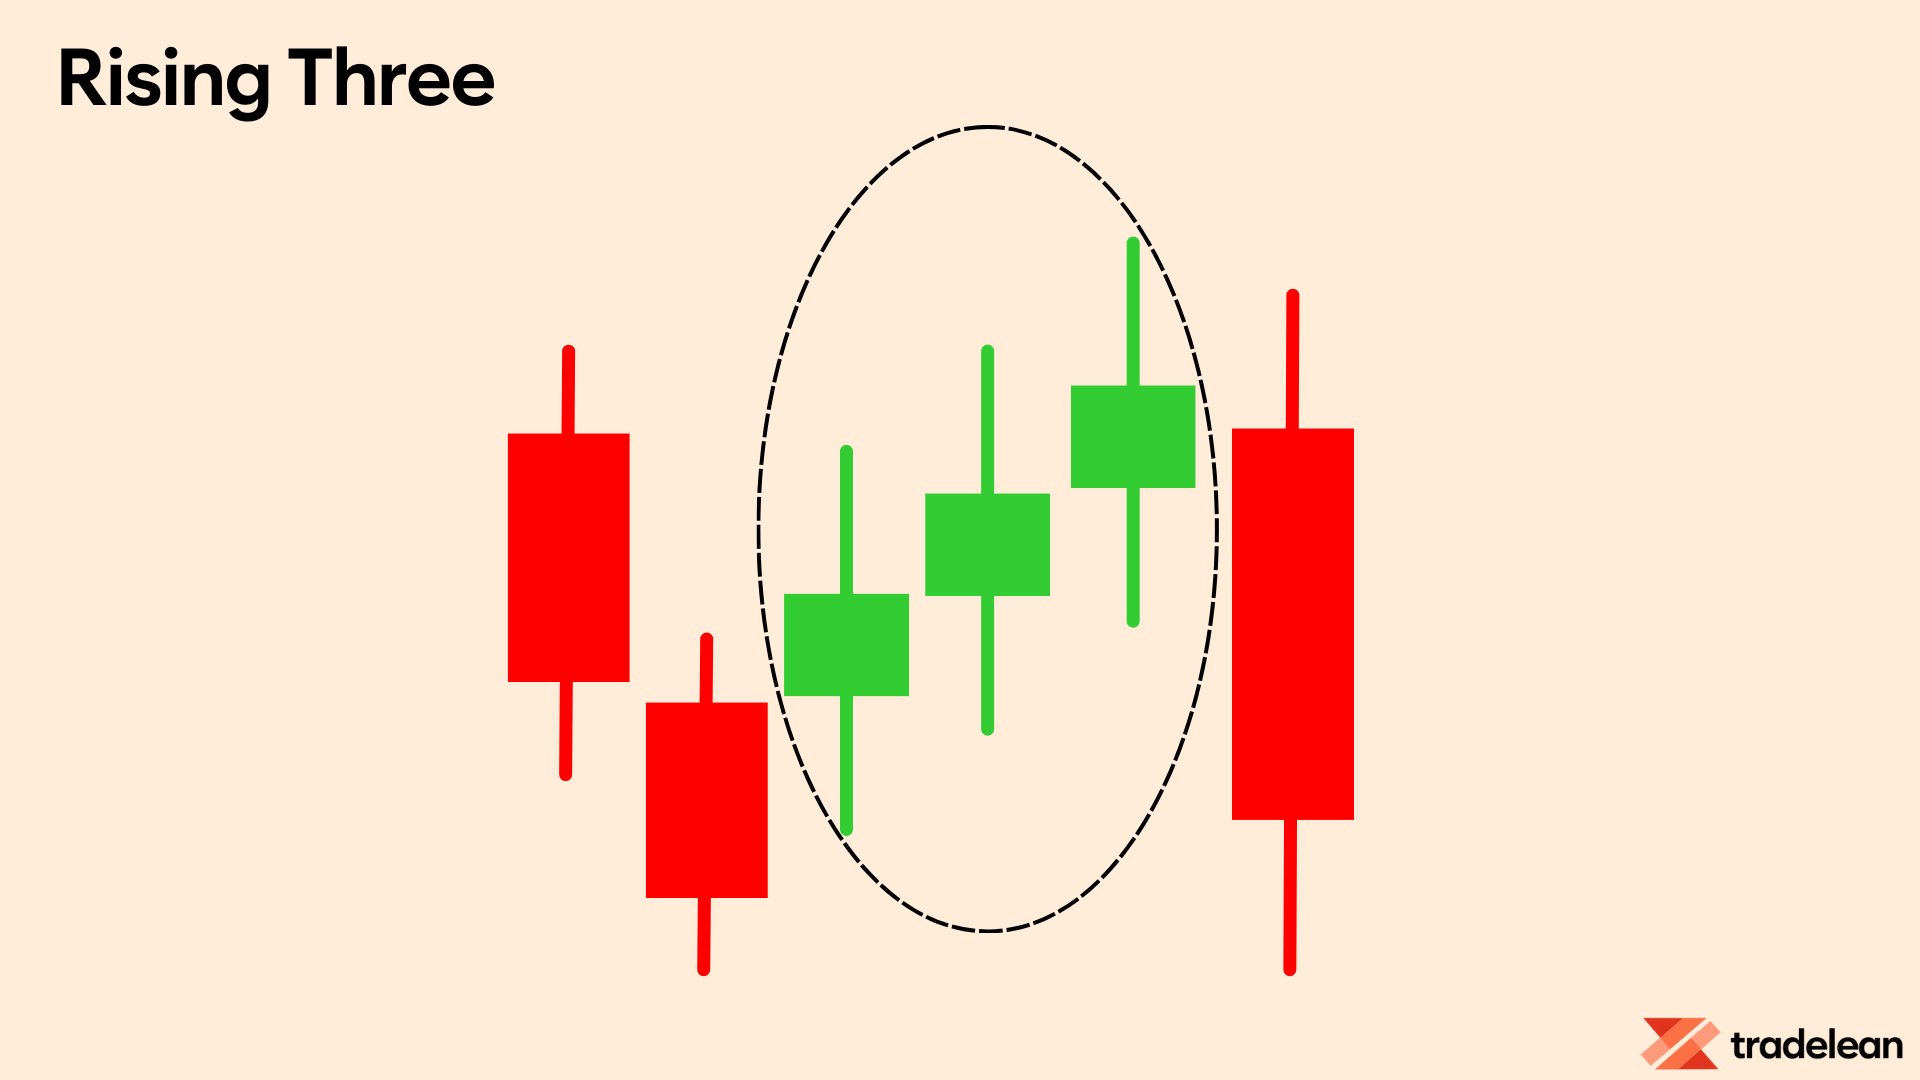
It consists of three short red candles sandwiched between two long green candles.
This pattern indicates that, despite some selling pressure, buyers are retaining control of the market and the uptrend is likely to continue.
Summary
Reading candlestick patterns is essential for mastering the art of trading.
These patterns provide deep insights into market psychology, highlighting the ongoing struggle between buyers and sellers.
By understanding these patterns, traders can interpret market movements more accurately, making informed decisions that enhance their trading outcomes.
Candlestick charts visually capture price movements over specified periods, making it easier for traders to identify trends and key levels of support and resistance.
Focusing on the essential candlestick types, such as Doji, Inside Bars, Engulfing Candles, and Pin Bars, simplifies analysis and sharpens trading strategies.
These patterns, particularly when they appear at significant support or resistance levels, are powerful indicators of potential market direction.
Moreover, recognizing the context of candlestick patterns—whether they signal indecision, reversal, or continuation—enables traders to anticipate market changes effectively.
Understanding the dynamics of breakouts, rejections, and fakeouts is crucial for confirming trends and avoiding false signals.
By integrating these insights with the TradeLean philosophy, which emphasizes simplicity and precision, traders can navigate the complexities of the market with greater confidence.
This holistic approach to reading candlestick patterns not only improves trading accuracy but also enhances profitability, paving the way for long-term success in the trading world.