Mastering Support and Resistance
Breaking down support and resistance, their significance and applications.

Introduction
In the challenging world of trading, few principles are as essential as price levels: support and resistance.
Support and resistance form the TradeLean cornerstone upon which effective trading is constructed and are discussed in Explaining TradeLean Levels section.
If you master the art of identifying and utilizing support and resistance levels, you are well on your way to becoming a proficient trader.
Luckily you have found TradeLean Strategy that will allow you to spot those price levels with precision!
However, before we talk about TradeLean levels, let's familiarise ourselves with general concepts of support and resistance.
This post delves into the theory, technical rules and practical application of support and resistance in trading, offering insights that can give you a significant edge in the market.
Understanding Support and Resistance
Support Level
Support refers to a price level where a downtrend is expected to pause due to a concentration of buying interest.

When the market price approaches this level, the likelihood of a reversal or a halt in the price drop increases, as traders begin to buy in anticipation of an upward movement.
Think of support as a price floor that prevents the market from falling further.
Resistance Level
Resistance, on the other hand, is a price level where an uptrend is expected to pause due to a surge in selling interest.

As the market price nears this level, the chances of a price reversal or a halt in the upward movement increase, as traders start selling in anticipation of a downturn.
Resistance acts as a price ceiling that limits the market's upward movement.
Zones Over Precise Levels
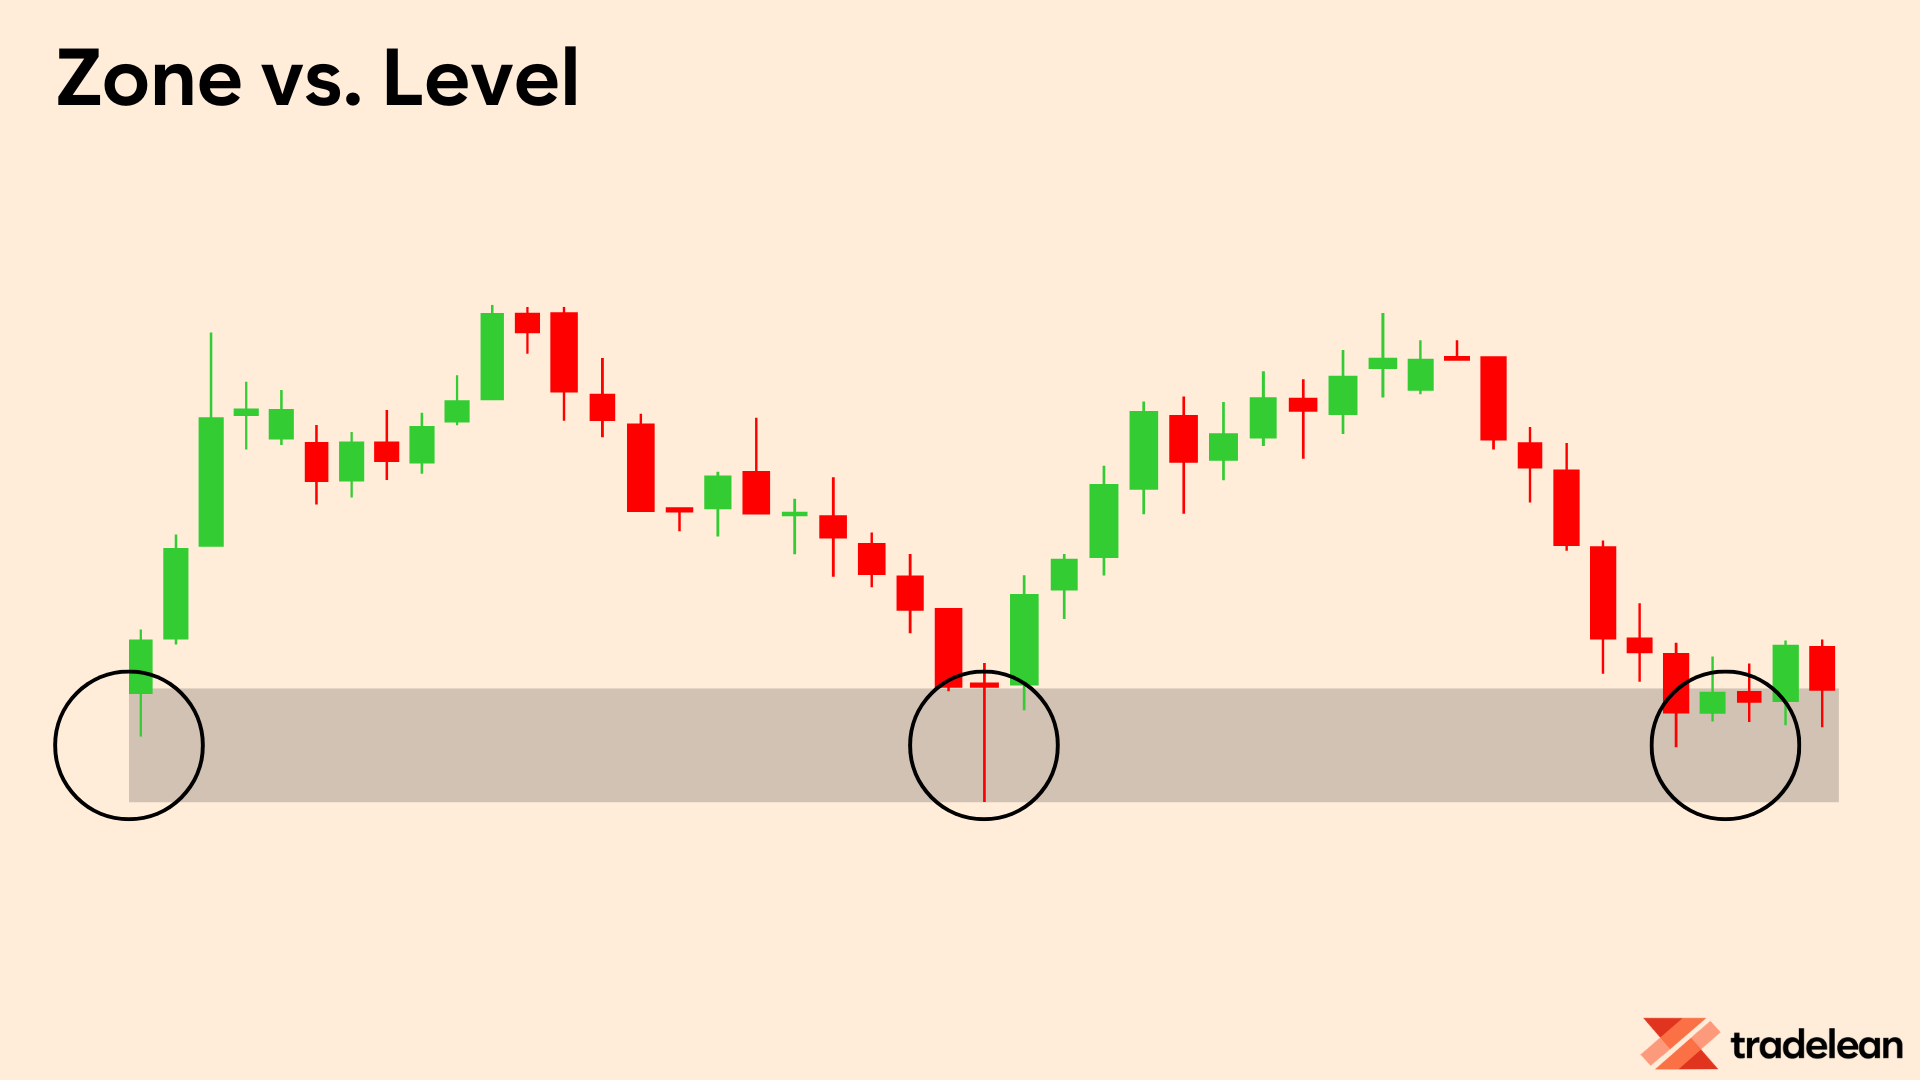
It's crucial to understand that support and resistance should be considered as zones rather than precise price levels.
I refer to it as a zone because it encompasses multiple support and resistance lines within a narrow range, often causing the market to become more volatile when it encounters these levels.

The market is inherently volatile, and expecting precision in such an environment is difficult, however you will be amazed with precision of TradeLean Price Levels.
How to Identify Support and Resistance
There are various methods to mark support and resistance levels, each offering unique insights into market behavior.
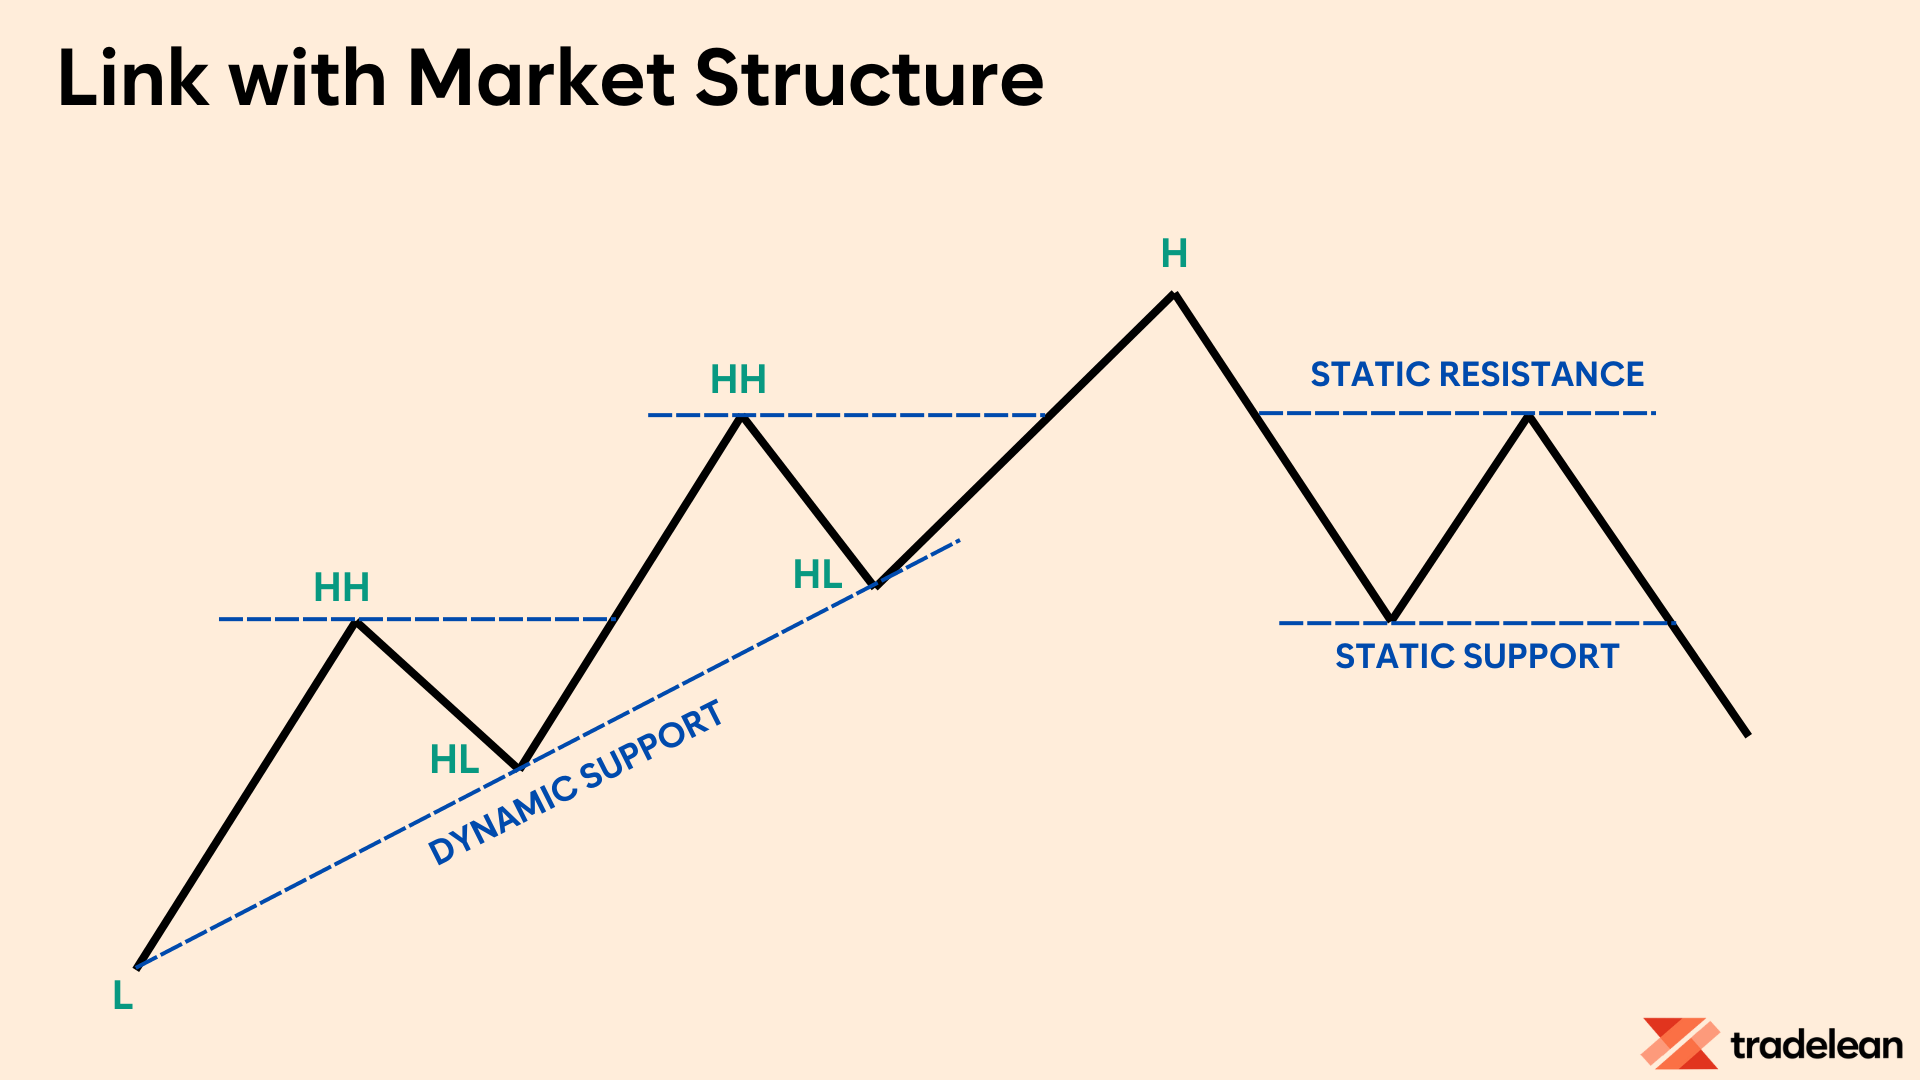
One important remark worth introducing at this stage is a categorisation of levels into Static support and resistance and Dynamic support and resistance.
Static Support and Resistance levels are fixed price points that do not change over time. Once identified, these levels remain constant regardless of future price movements. They are typically derived from historical price data and key levels observed in the market, such as previous swing highs and lows. Static support and resistance are often represented by horizontal lines on a chart.
Dynamic Support and Resistance levels, on the other hand, change over time and are influenced by the current price action and market conditions. These levels move in accordance with the underlying price trend and are often represented by trendlines or moving averages. Dynamic support and resistance provide a more flexible approach to identifying key levels in the market.
TradeLean Price Levels could be considered both, Static and Dynamic.
Here, we'll explore some of the most effective techniques to identify support and resistance.
Linking It With Market Structure
One of the most fundamental ways to identify support and resistance is by analyzing market structure.
This involves identifying swing highs and lows in the price charts.
By connecting these points, traders can project horizontal lines that serve as support or resistance.
- Horizontal Support and Resistance (Static): Draw horizontal lines from significant swing highs and lows. These lines represent basic support and resistance levels.
- Trendlines (Dynamic): Connect two or more swing highs or lows to create trendlines. These lines can indicate the direction of the trend and potential support or resistance levels along the trend.

This is the most solid and simple way to identify support and resistance.
Other ways to identify support and resistance levels highlighted below are less relevant in the context of TradeLean strategy, used as a confluence and are given just for your information.
Projected by Computation
Some support and resistance levels can be determined through calculations based on past price movements.
- Fibonacci Retracements and Extensions: These are based on the Fibonacci sequence and help identify potential reversal levels.
- Moving Averages: Different types of moving averages can act as dynamic support or resistance levels.
- Volatility Bands: Bollinger Bands and Keltner Channels provide dynamic levels based on volatility.
- Calculated Pivots: Pivot points and other calculated levels like Fibonacci, Camarilla and Woodies pivots can indicate key support and resistance zones.
Price and Volume Formations
Price and volume themselves can form recognizable patterns that indicate support and resistance.
- Price Gaps: Gaps in price action can act as significant support or resistance levels.
- Congestion Zones: Areas where price consolidates can serve as strong support or resistance zones.
- Climactic Volume: High volume at a specific price level can indicate strong support or resistance.
- VWAP (Volume Weighted Average Price): This line can act as dynamic support or resistance.
Psychological Support and Resistance
Certain price levels are significant due to their psychological impact on investors and traders.
- Round Numbers: Prices like 100, 1000, etc., often act as psychological barriers.
- 52-Week Highs and Lows: These levels can act as significant support or resistance due to their prominence.
Significance of Support and Resistance
Identifying support and resistance levels is just the beginning.
Analyzing their significance is crucial for effective trading.
Below you will find some criteria to judge the significance of the support and resistance that are important in the context of the TradeLean Strategy.
How Many Times Has the Market Touched the Level?
The more times a market tests a support or resistance level, the more significant it becomes.
However, repeated tests can also weaken the level as buying or selling interest gets exhausted.
Price Interaction with the Level
Observe how the market behaves when it approaches the support or resistance level.
For example, vigorous reactions, such as long lower shadows of candles at support, indicate strong interest and reliability.
Decisive Breaks
A decisive break through a support or resistance level can signal the end of its effectiveness.
Support-Resistance Flipping
When support becomes resistance or vice versa after being decisively broken, it indicates a significant shift in market dynamics.
Timeframe Consideration
Support and resistance levels identified on higher timeframes (like weekly or monthly charts) are generally more significant than those on lower timeframes (like 5-minute or 15-minute charts).
Relevance to Trading Horizon
Ensure the support and resistance levels are relevant to your trading horizon.
For example, intraday traders might not find monthly levels as useful as those on a 15-minute chart.
Confluence
Confluence occurs when multiple support or resistance methods indicate the same level.
For example, a horizontal support line coinciding with a Fibonacci retracement level or coinciding at different timeframes increases the reliability of that zone.
Summary
Support and resistance are fundamental elements in trading, serving as critical tools for understanding market dynamics.
Mastery of these concepts, as emphasized in the TradeLean Strategy, is essential for any trader aiming to improve their performance.
Recognizing and effectively utilizing support and resistance levels can significantly enhance your trading strategy by providing clearer insights into market behavior.
Support levels act as price floors where buying interest prevents further declines, while resistance levels serve as price ceilings where selling interest halts upward movements.
These levels are not fixed but exist within zones, reflecting the market's inherent volatility.
Identifying these zones accurately is crucial, and techniques like analyzing market structure and using dynamic indicators such as trendlines and moving averages can be very effective.
The significance of support and resistance levels is also determined by factors such as the number of times the level is tested, price reactions, and the timeframe on which they are identified.
Higher timeframe levels generally hold more weight and are more reliable.
Additionally, the concept of confluence, where multiple indicators point to the same level, can increase the reliability of these zones.
Incorporating support and resistance analysis into your trading approach, along with other foundational elements like market structure, will enhance your ability to make strategic decisions.
By consistently applying these principles, you can navigate the complexities of the market with greater confidence, ultimately paving the way for long-term trading success.