Navigating Chart Patterns
Learn to recognize and leverage key chart patterns to enhance your market analysis.
Introduction
In the dynamic world of trading, recognizing and interpreting chart patterns is akin to learning a new language.
These patterns, like words, tell stories about market sentiment, investor behavior, and potential future movements.
They are a result of a price action developing in time on the chart.
Let's delve into these patterns and see how they can help you become better traders, not just technically but also mentally and emotionally.
Reversal Patterns
The W Pattern
Also known as the double bottom, the W pattern indicates a bullish reversal.
It forms after a downtrend, characterized by two distinct troughs at approximately the same price level.
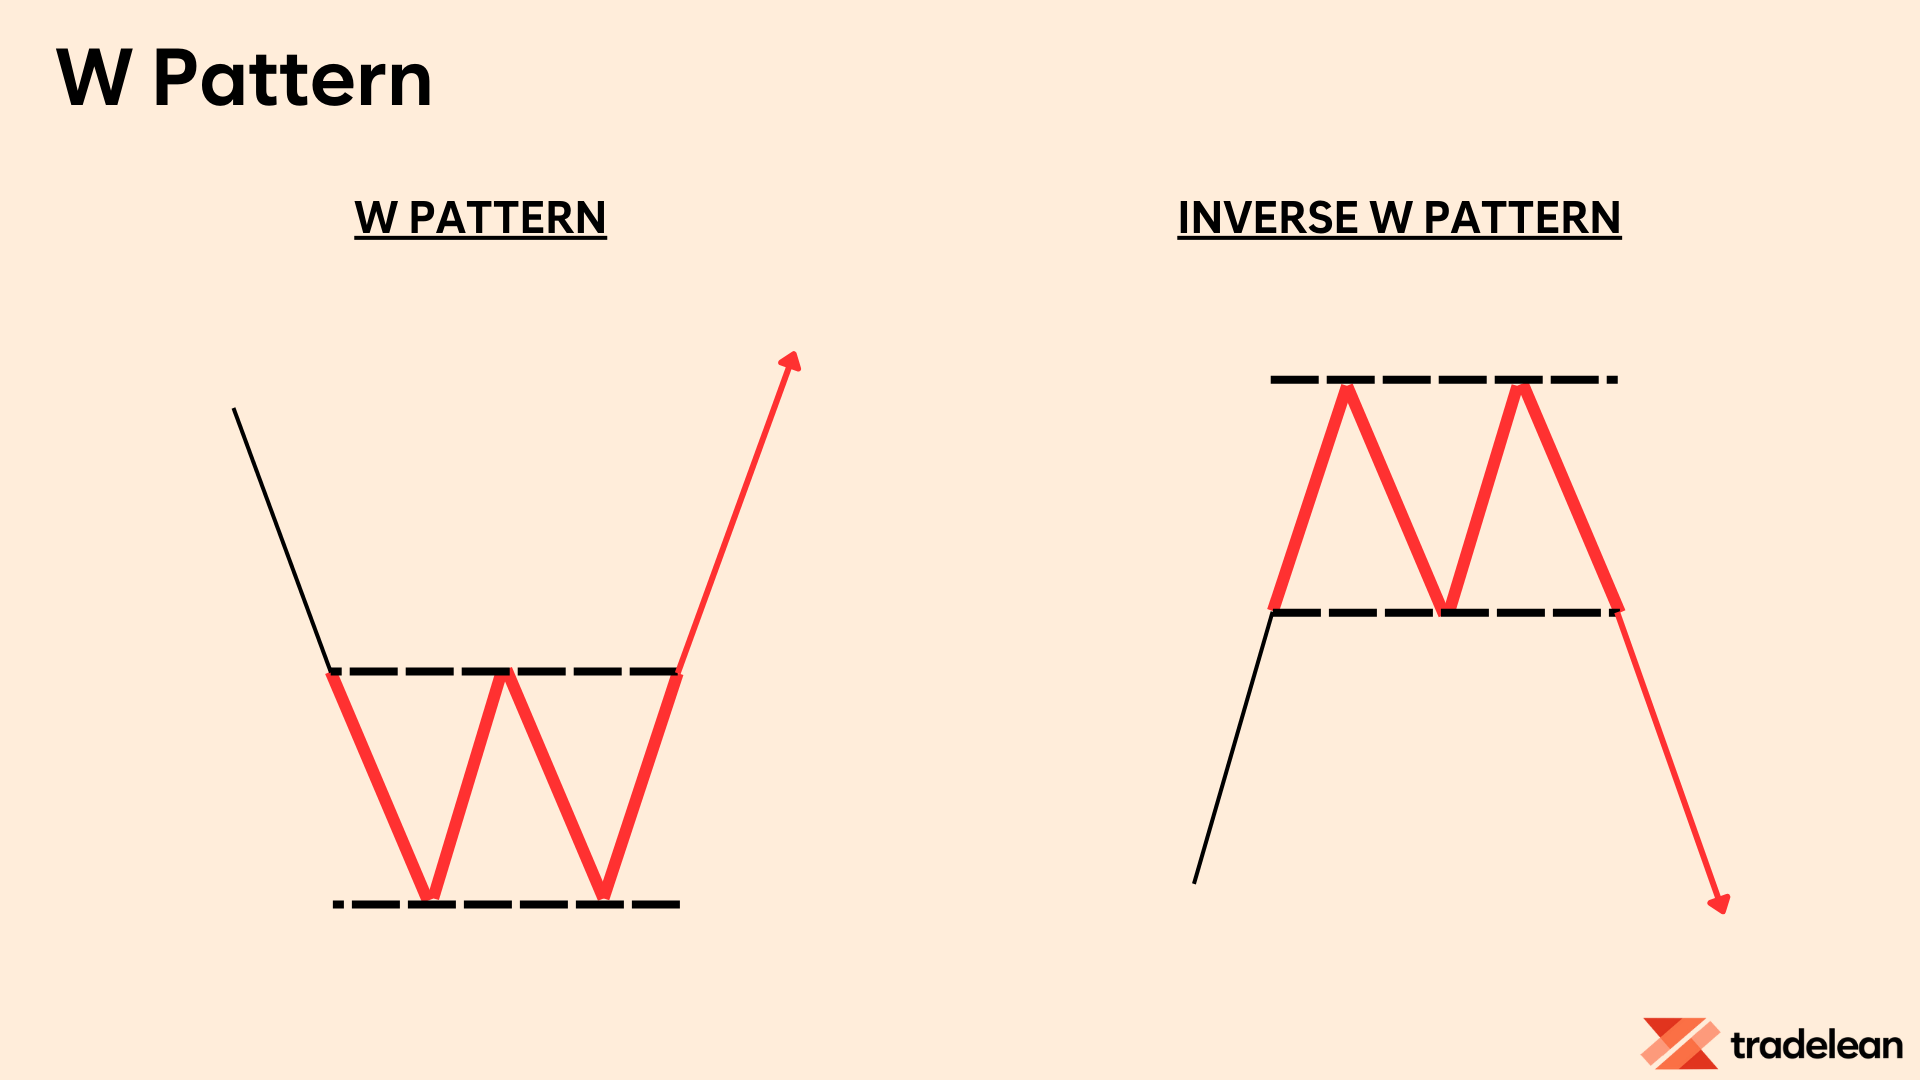
The W pattern reflects a market bottom where the price has tested the support level twice without breaking it.
This shows strong buying interest, and once the price breaks above the resistance level formed between the two bottoms (also called as Double Bottom pattern), it typically signals the start of a bullish trend.
The Head and Shoulders Pattern
The head and shoulders pattern is a powerful reversal pattern.
It features three peaks: a higher middle peak (head) flanked by two lower peaks (shoulders). This pattern signals a trend reversal and is considered one of the most reliable patterns.
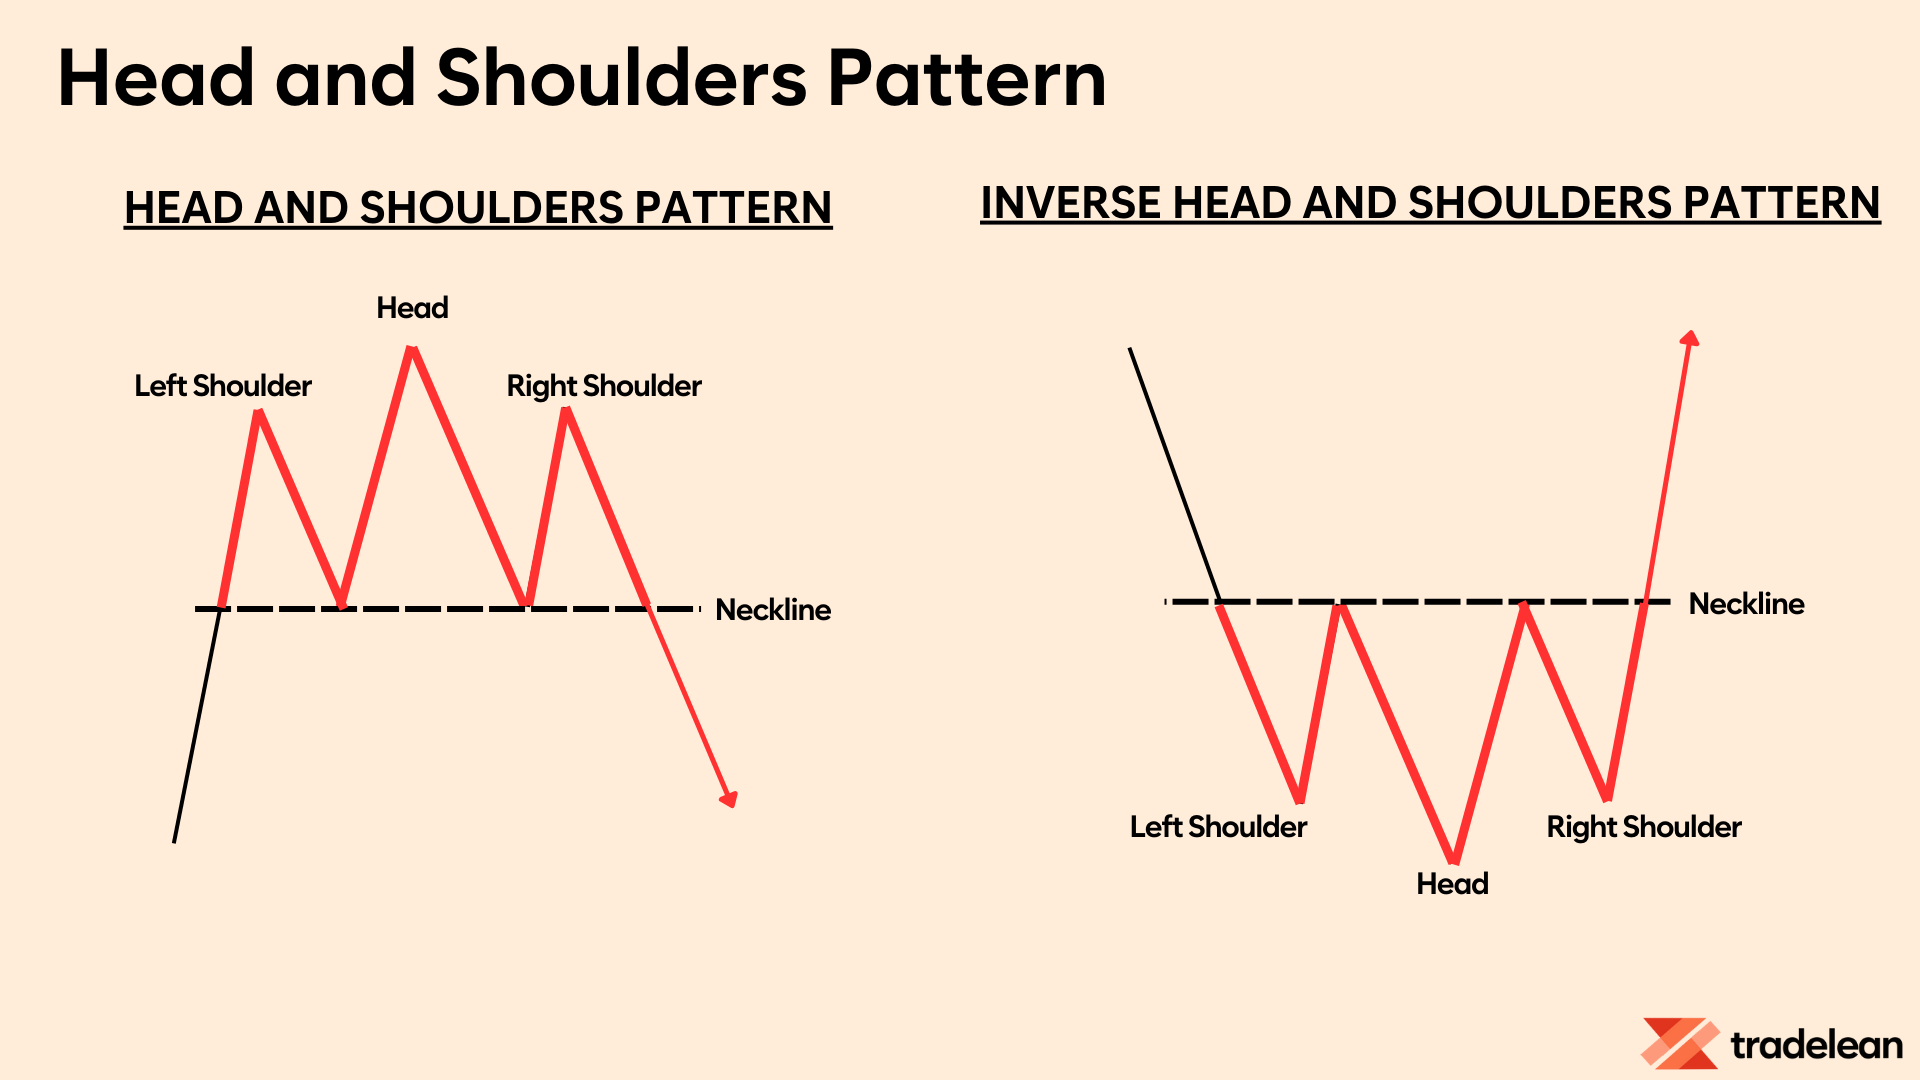
The neckline, connecting the lows of the two shoulders, serves as a key level.
A break below the neckline indicates a bearish reversal, while an inverse head and shoulders pattern indicates a bullish reversal.
The Rounded Top or Bottom Pattern
Rounded tops and bottoms are long-term reversal patterns.
They indicate a gradual shift in market sentiment and are often seen in weekly or monthly charts.
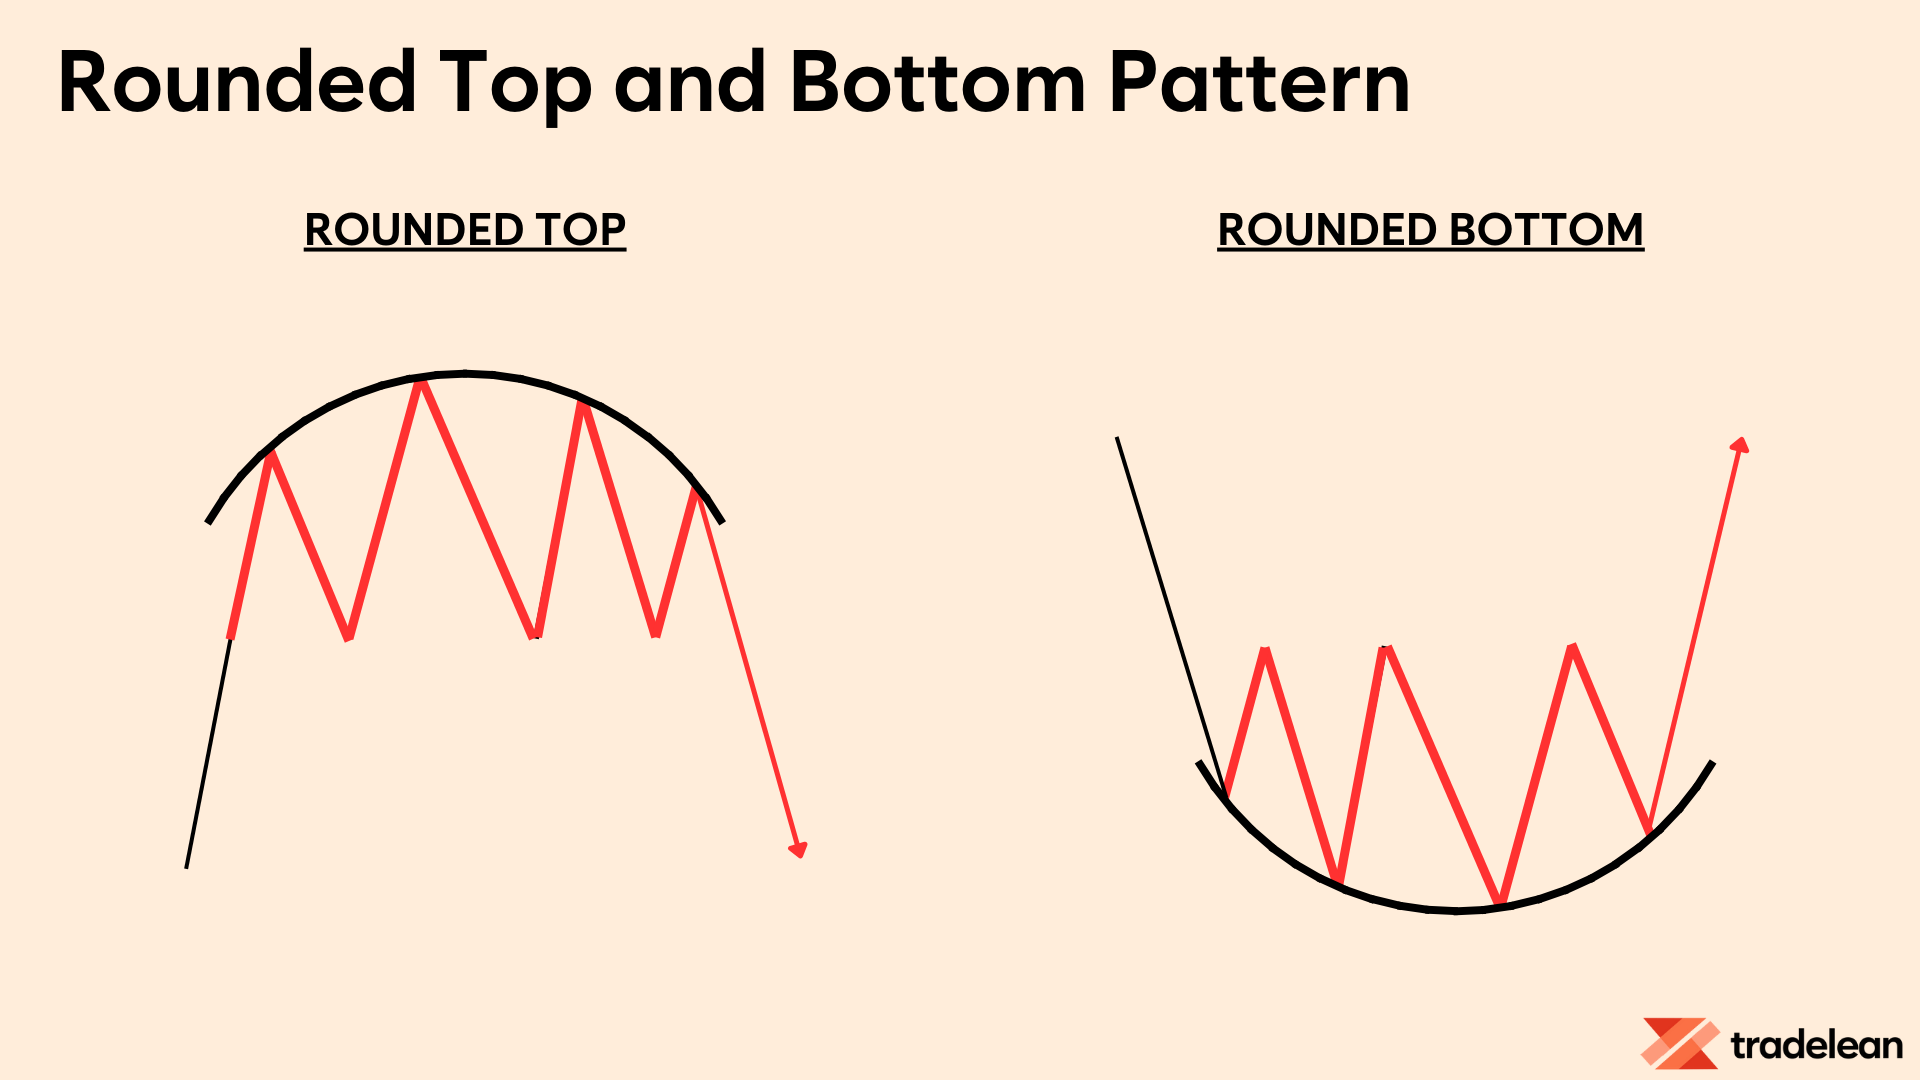
Rounded tops and bottoms are reliable indicators of significant trend changes.
They require patience and a long-term perspective, as the formation of these patterns can take several weeks or months.
The Falling Wedge Pattern and Rising Wedge Pattern
Falling wedges are bullish reversal patterns, while rising wedges are bearish.
They form when the price makes lower highs and lower lows (falling) or higher highs and higher lows (rising).

Wedges are critical in identifying potential reversals.
A falling wedge indicates a slowdown in selling pressure, suggesting a bullish reversal.
Conversely, a rising wedge indicates weakening buying pressure, suggesting a bearish reversal.
Continuation Patterns
The Pennant Pattern
A pennant pattern forms after a strong price movement, followed by a consolidation phase with converging trend lines.
This is typically a continuation pattern, indicating that the previous trend will resume.
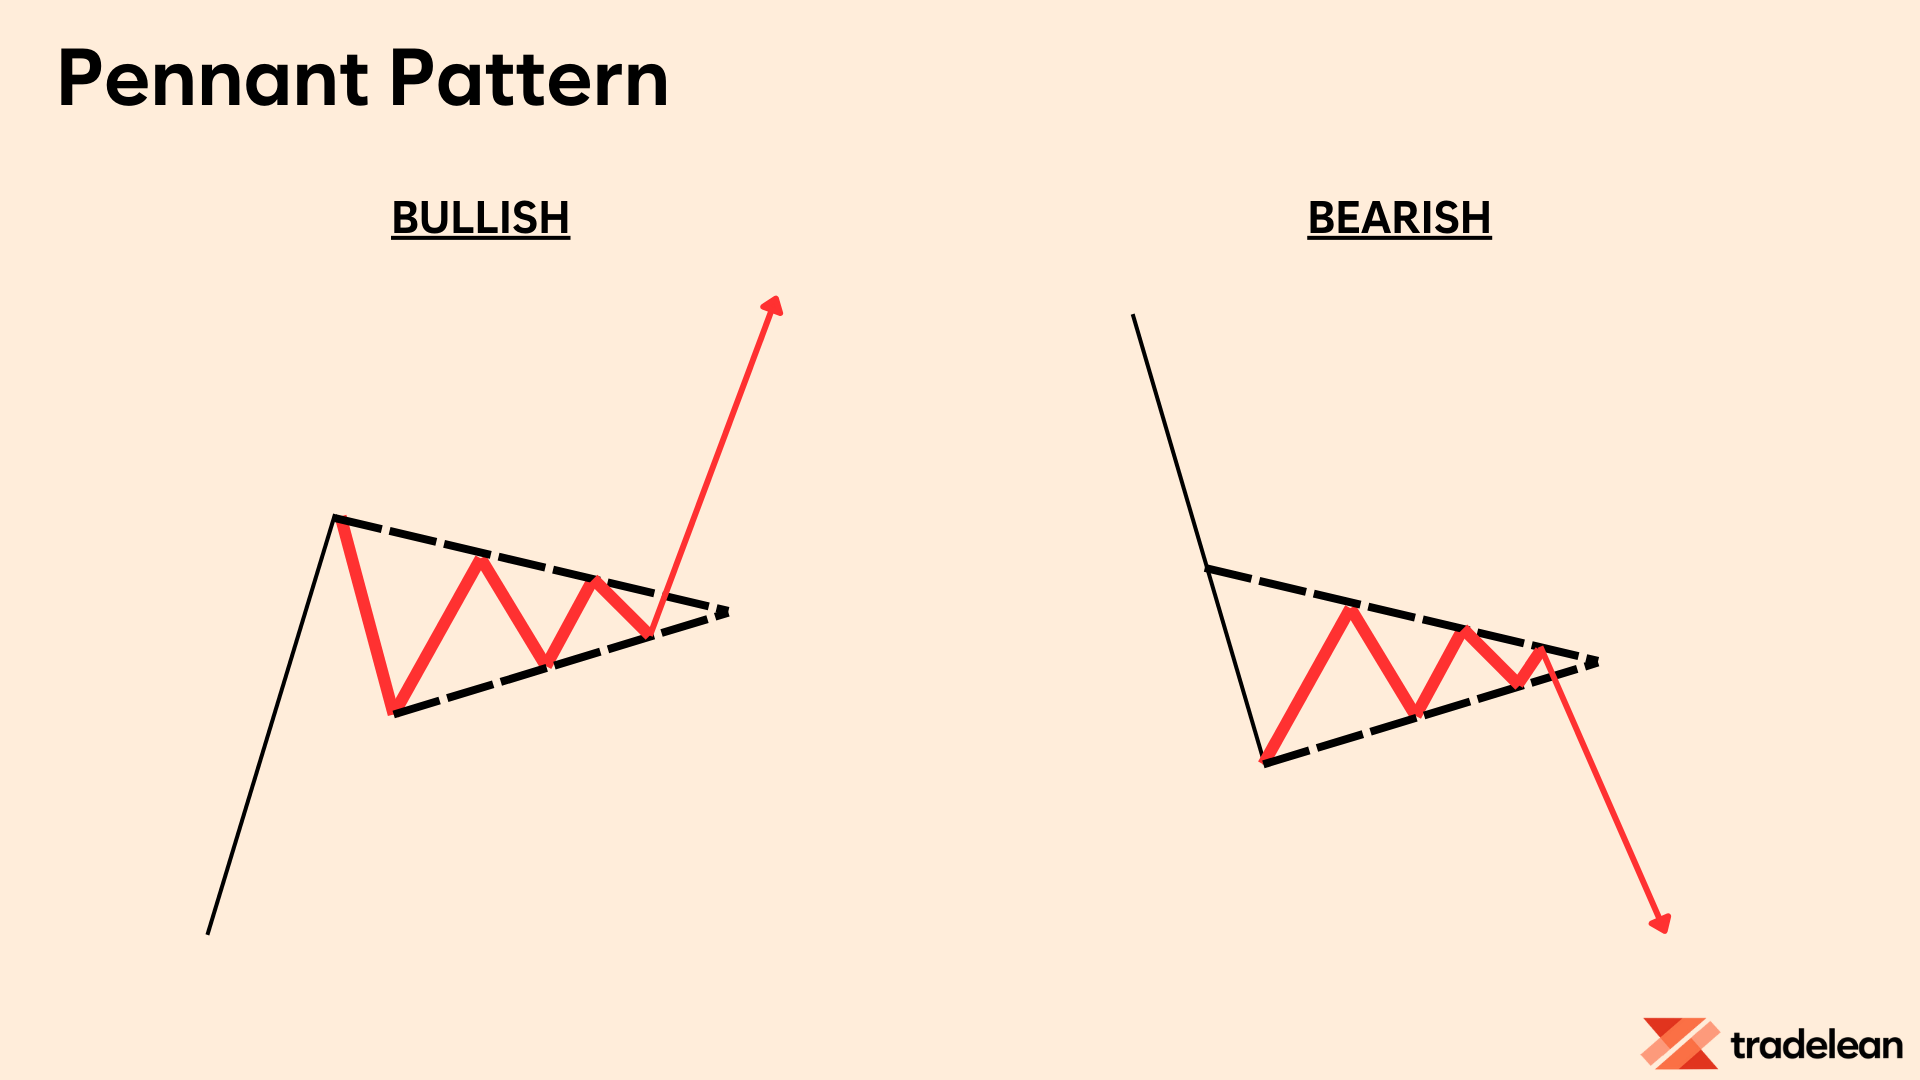
Pennants are known for their short duration and sharp breakouts.
They are formed due to a brief period of consolidation before the market continues in the direction of the initial move, driven by renewed momentum.
The Flag Pattern
Similar to the pennant, the flag pattern occurs after a sharp price movement and is characterized by parallel trend lines.
It signals a continuation of the previous trend.
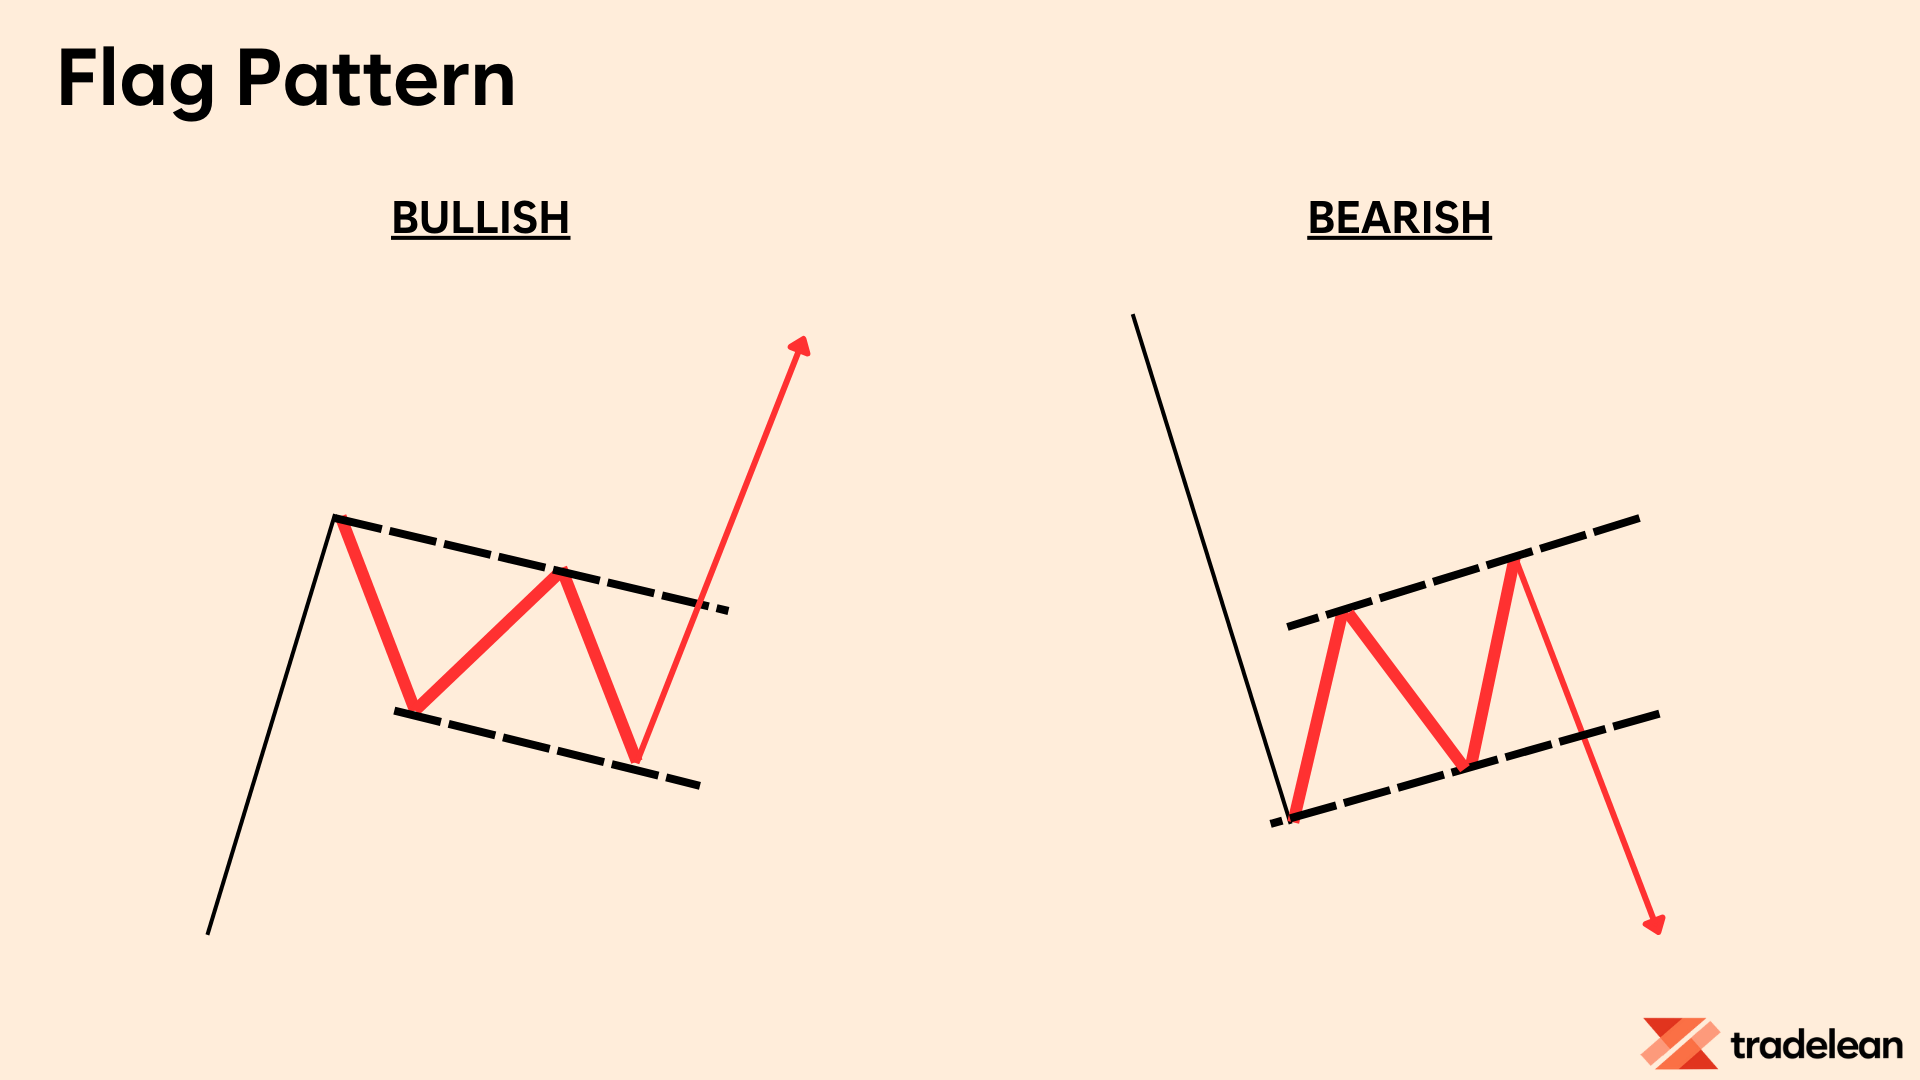
Flags are often seen in fast-moving markets and are reliable indicators of trend continuation.
The consolidation within the flag is usually brief, and the breakout often mirrors the size of the initial price movement.
The Cup and Handle Pattern
The cup and handle pattern is a bullish continuation pattern resembling a teacup.
The cup forms after a rounded bottom, followed by a handle that slopes downwards.
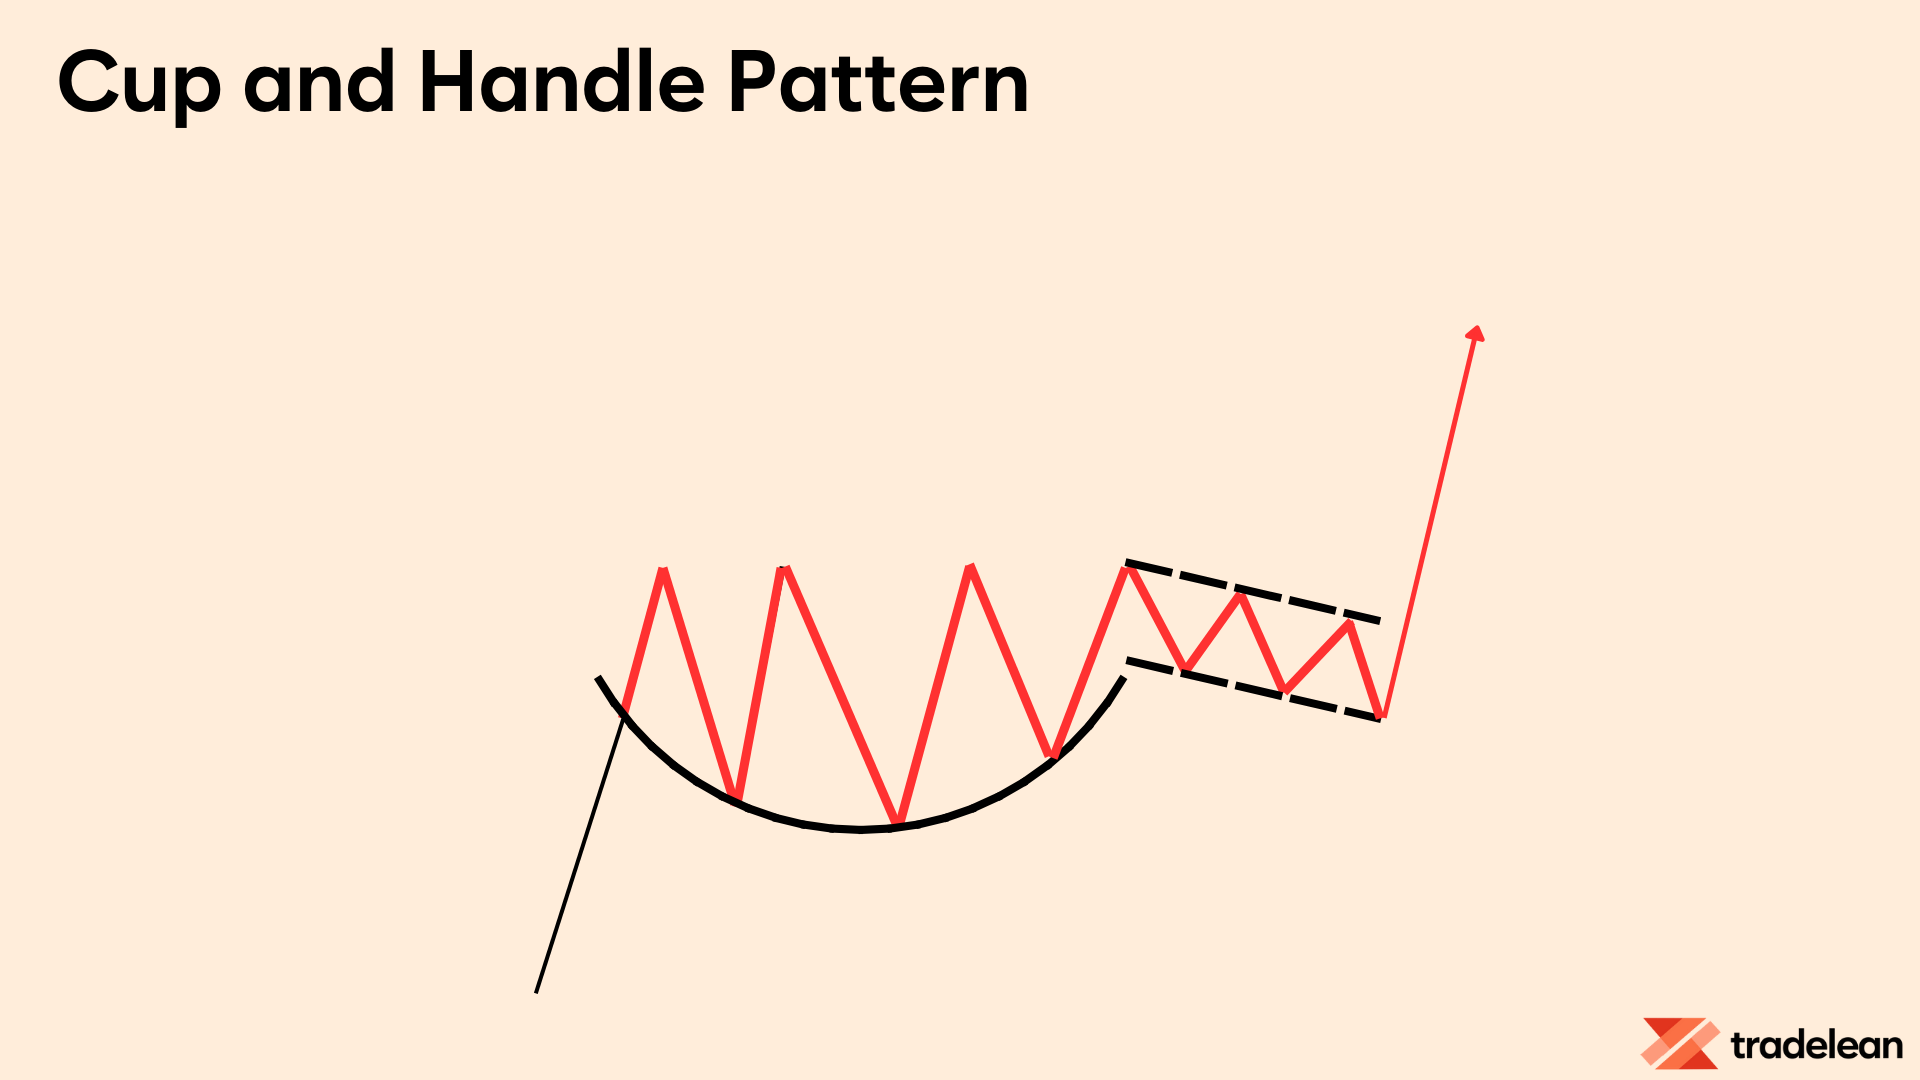
This pattern is often seen in growth stocks and indicates a period of consolidation before the uptrend continues.
The handle represents a temporary pullback that allows for a better entry point before the breakout.
The Rectangle Pattern
Rectangles are continuation patterns formed by horizontal support and resistance levels.
The price bounces between these levels before breaking out.
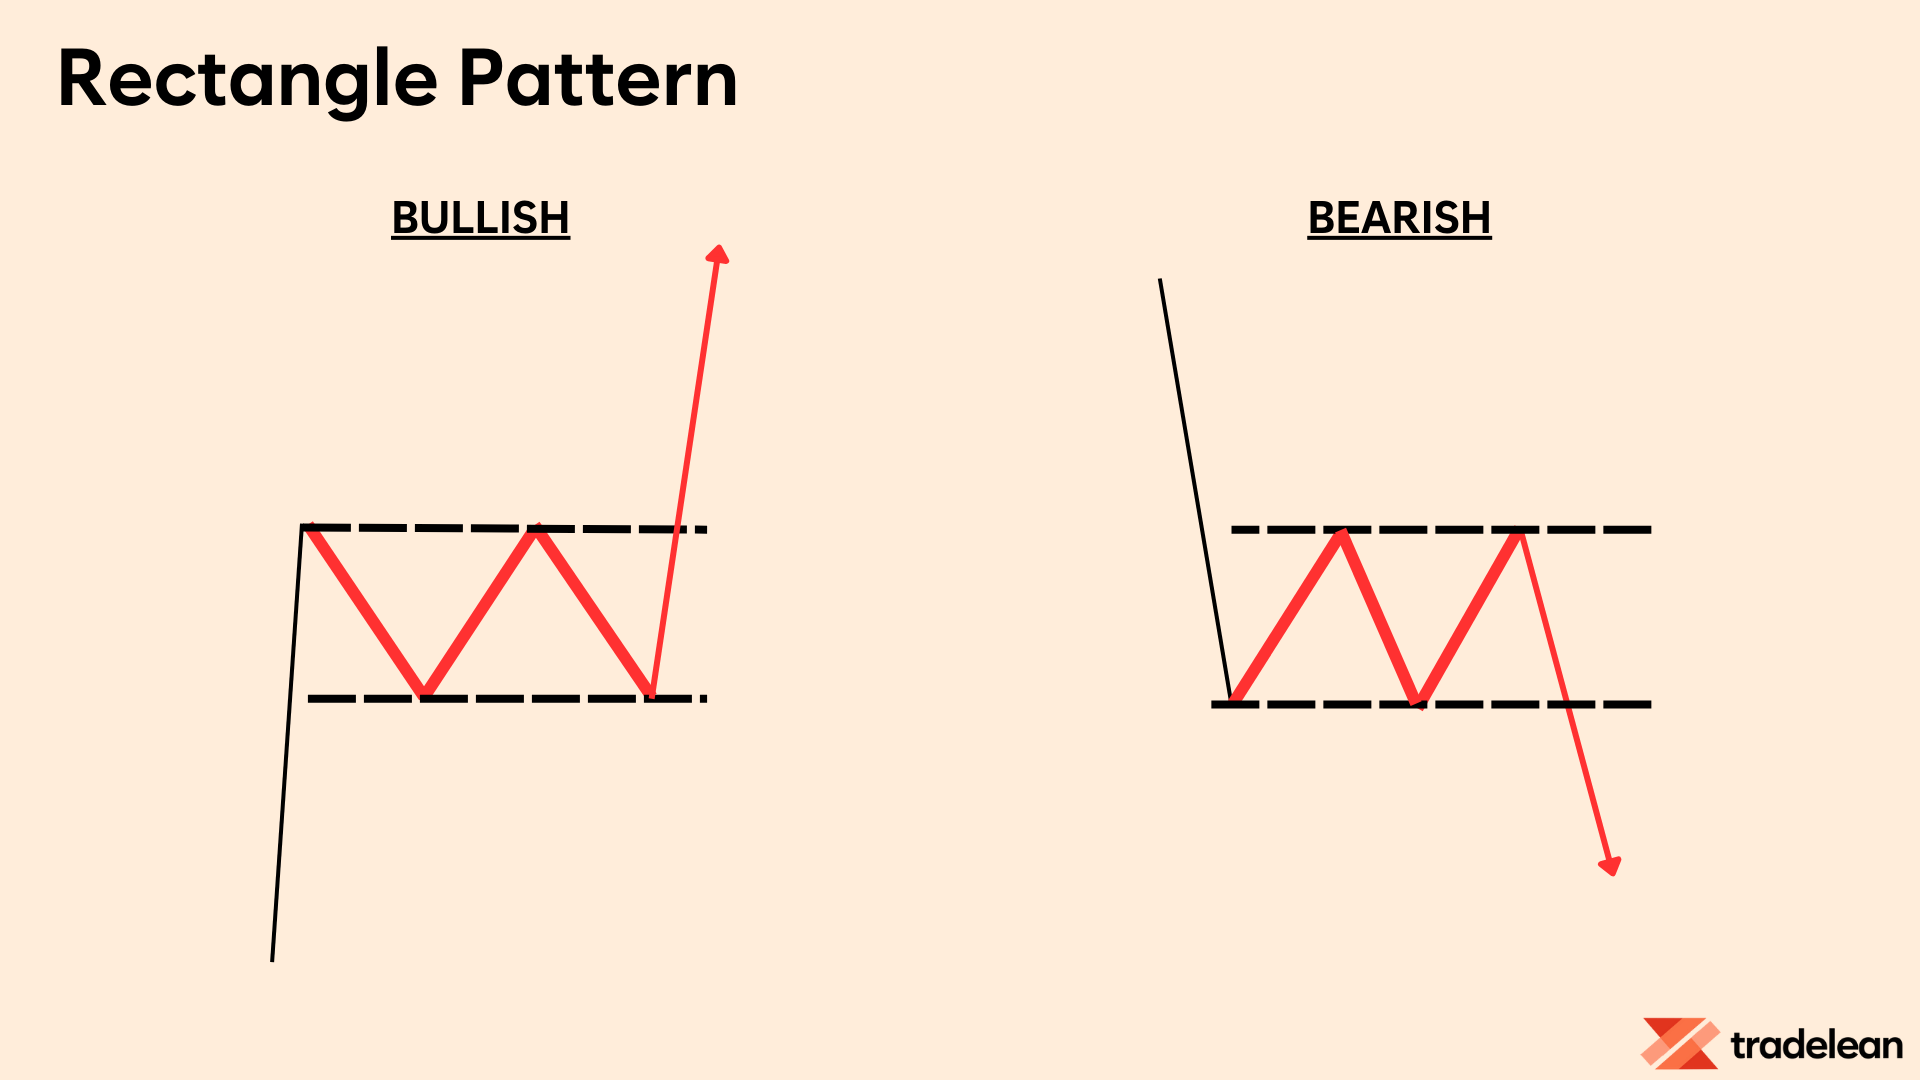
Rectangles indicate a period of consolidation where the market is gathering strength for the next move.
The breakout direction provides a clue about the future trend, with the height of the rectangle serving as a potential price target.
The Ascending Triangle Pattern and Descending Triangle Pattern
Ascending triangles have a flat top and rising bottom trend line, indicating bullish bias.
Descending triangles have a flat bottom and descending top trend line, indicating bearish bias.
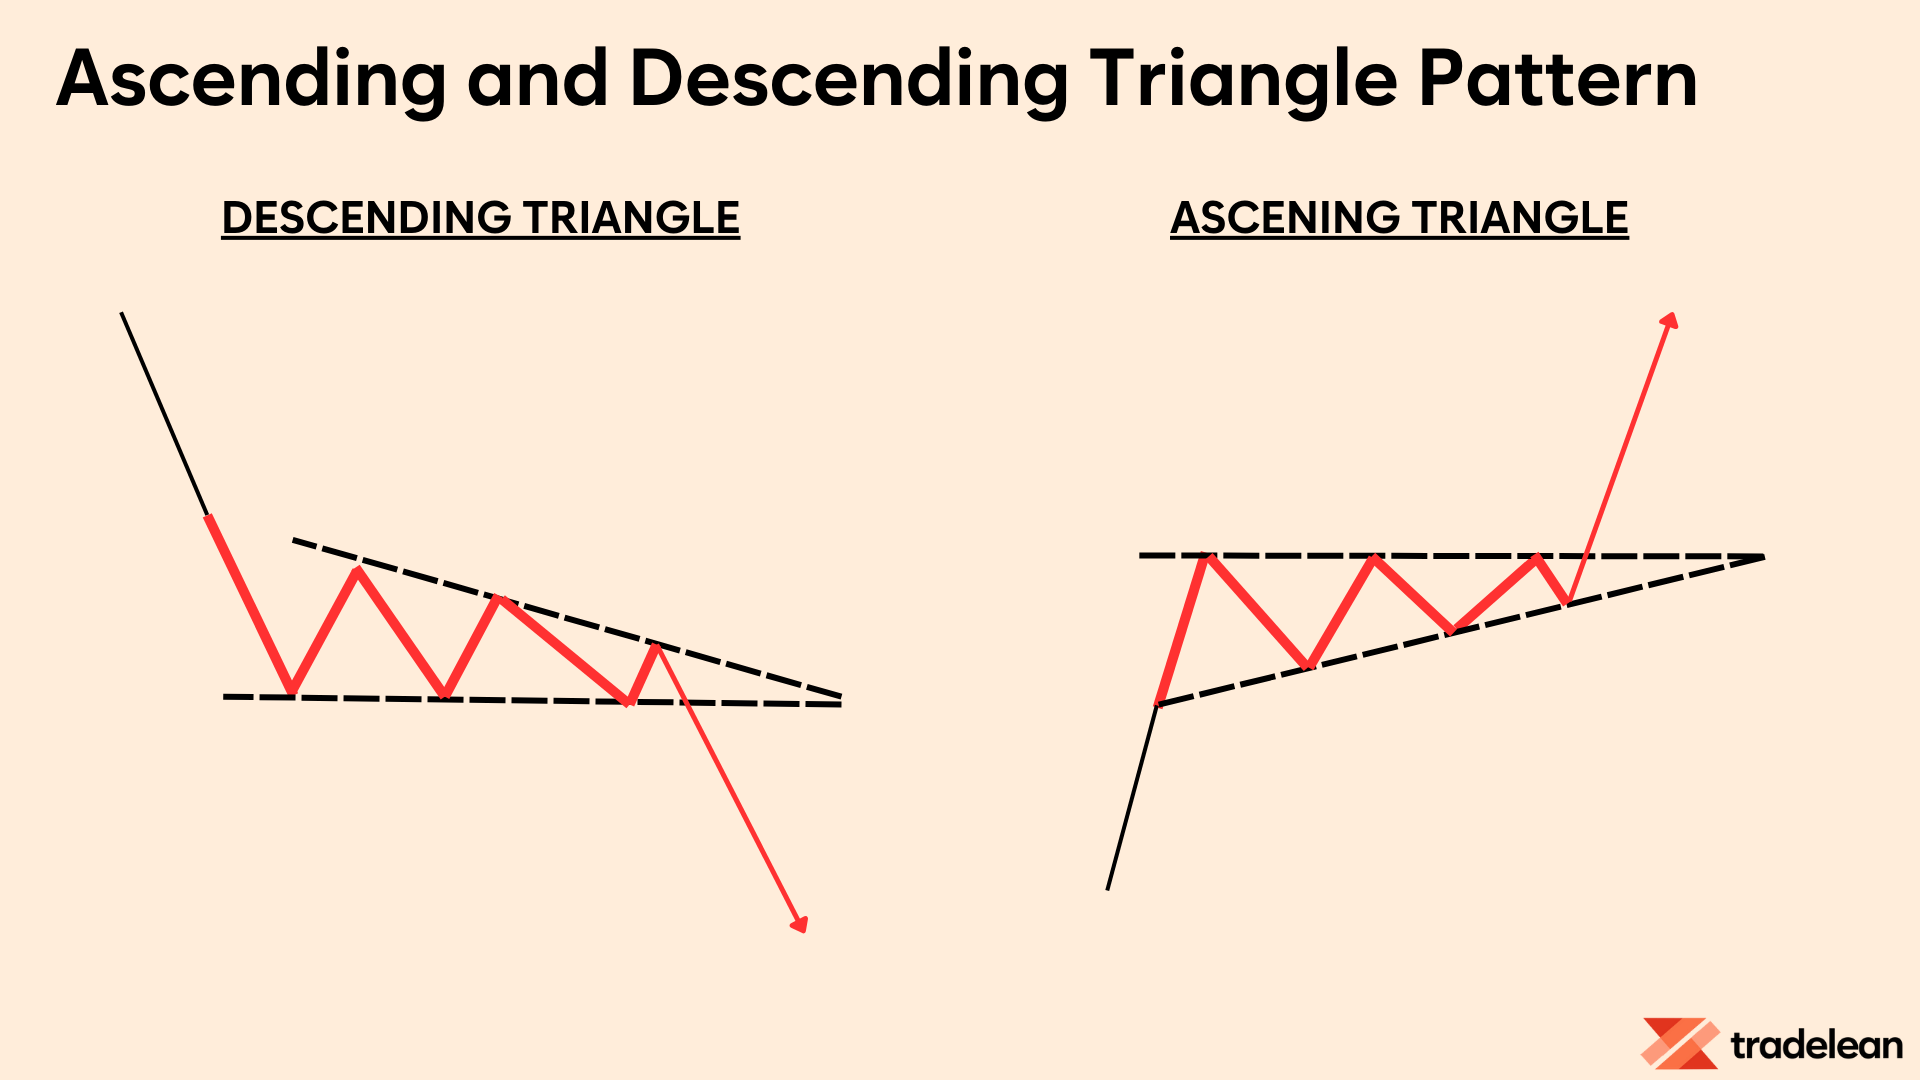
Ascending and descending triangles are reliable indicators of trend continuation or reversal.
The breakout from these patterns is usually accompanied by an increase in volume, confirming the new trend direction.
The Channel Pattern
Channel patterns are formed by parallel trend lines that guide the price movement.
They can be ascending, descending, or horizontal.
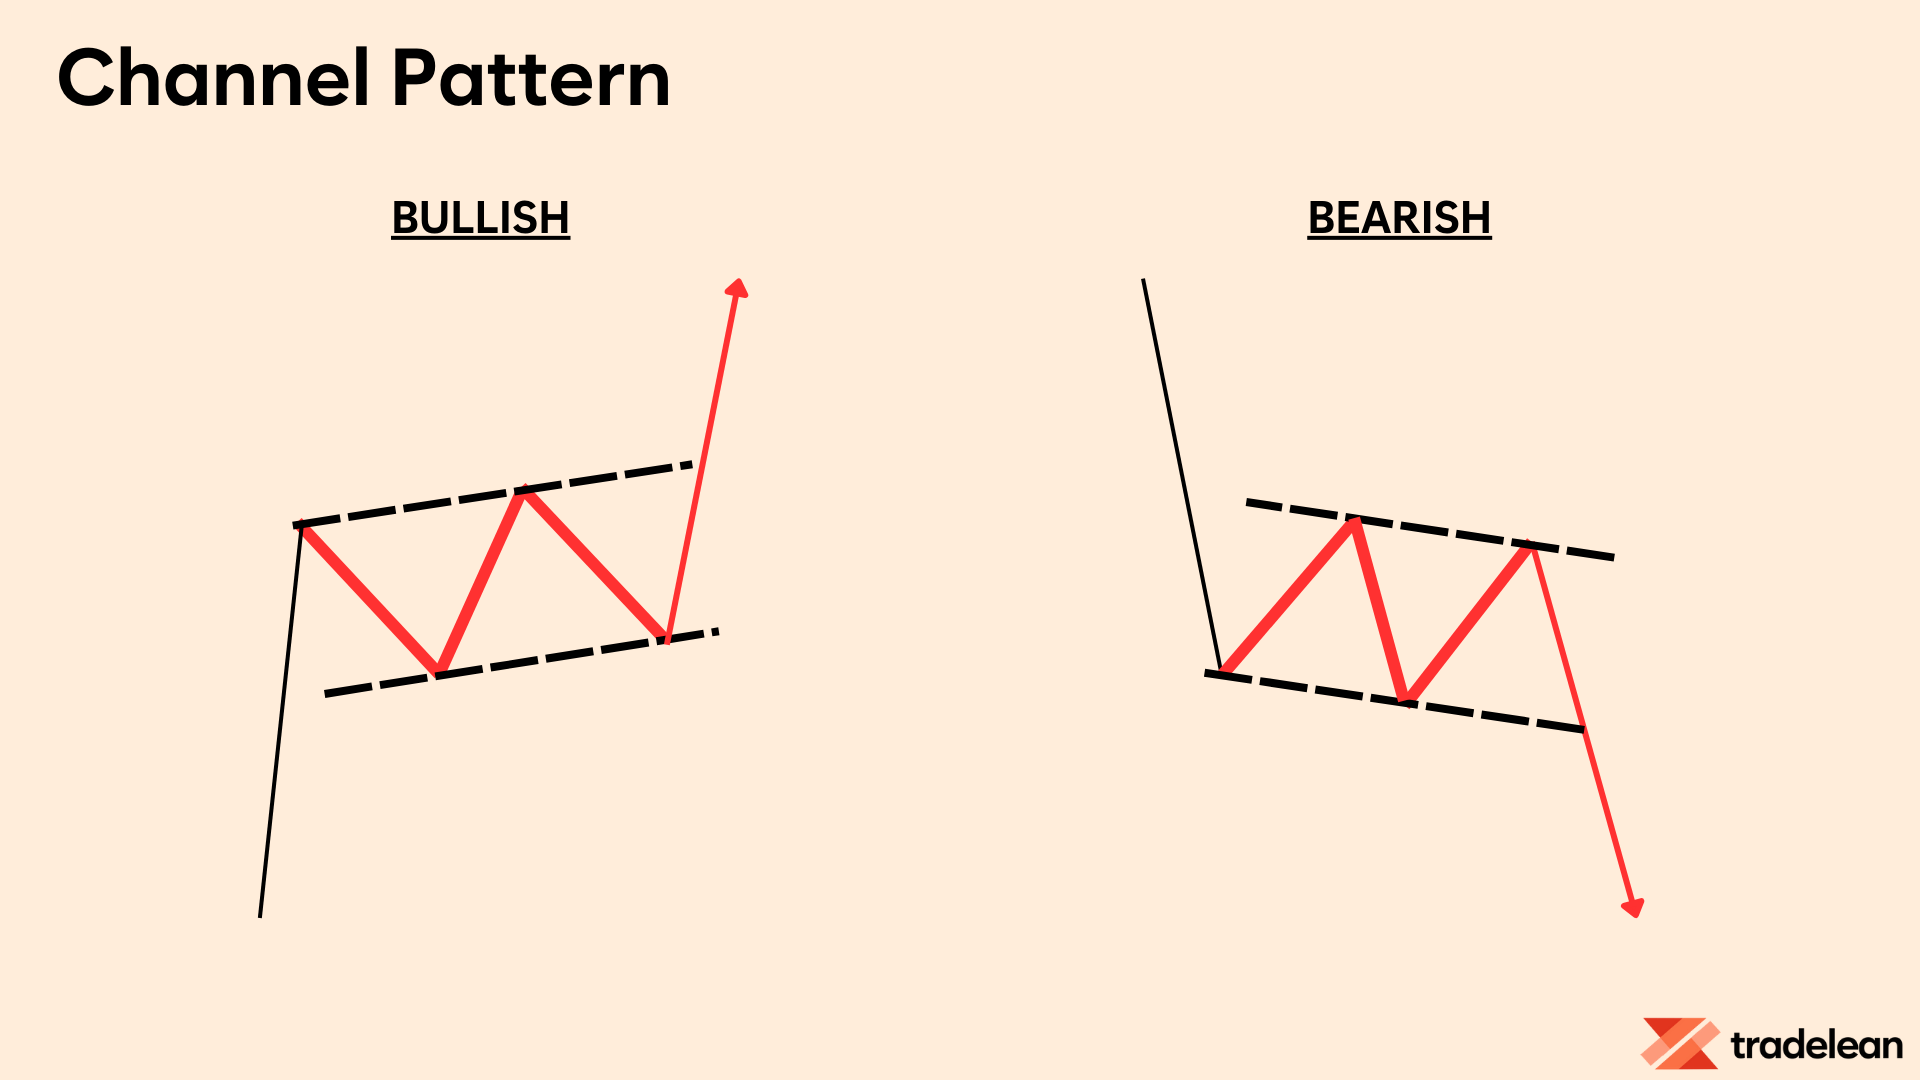
Channels are useful in identifying the direction of the trend and potential reversal points.
Trading within the channel allows traders to capitalize on smaller price movements, while breakouts can signal larger trend shifts.
Bilateral Patterns
The Megaphone Pattern
The megaphone pattern, or broadening formation, can indicate volatility and is often seen before a significant market move.
It consists of higher highs and lower lows, creating a megaphone shape.
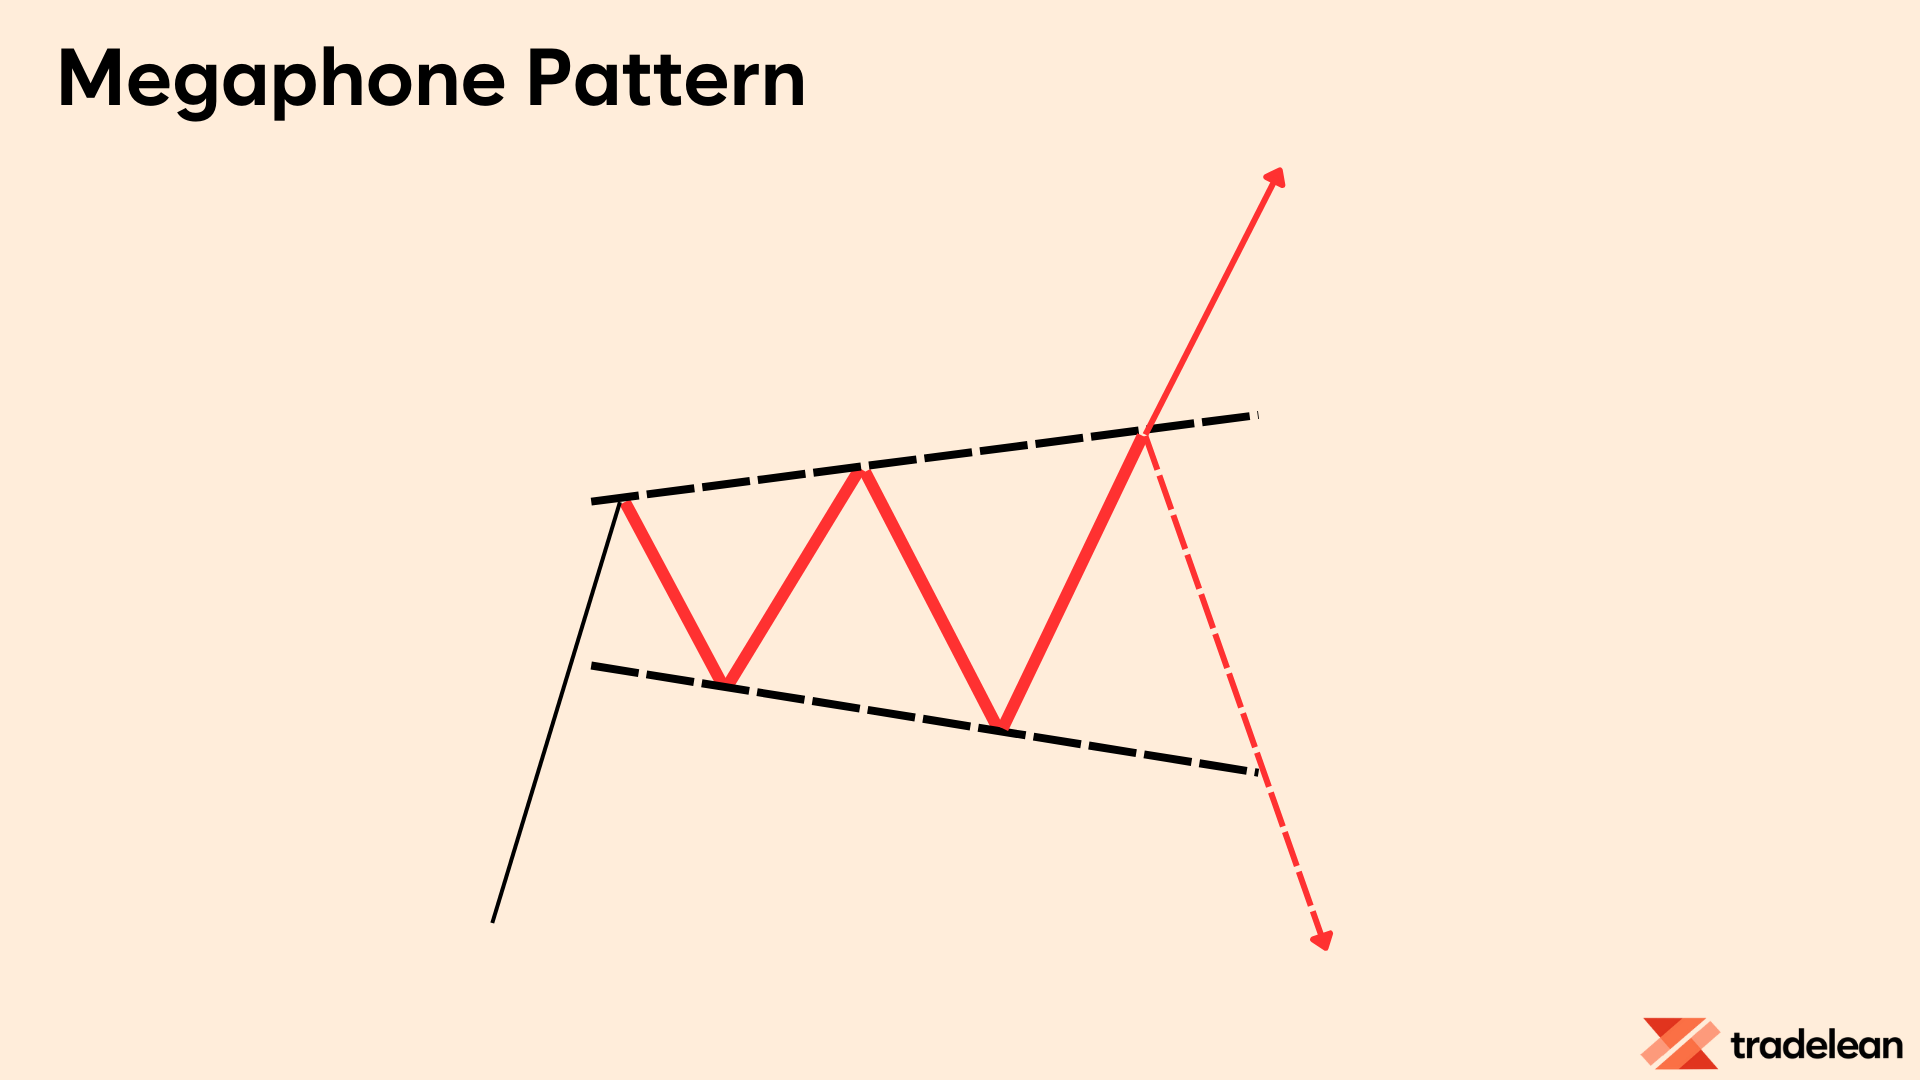
This pattern can be tricky as it shows a market in turmoil, with increasing volatility and no clear direction.
Observing the market behavior closely is crucial as a breakout from this pattern can lead to substantial price movements.
The Symmetrical Triangle Pattern
A symmetrical triangle is a neutral pattern where the price converges into a tight range, indicating indecision in the market.
The breakout direction can be bullish or bearish.
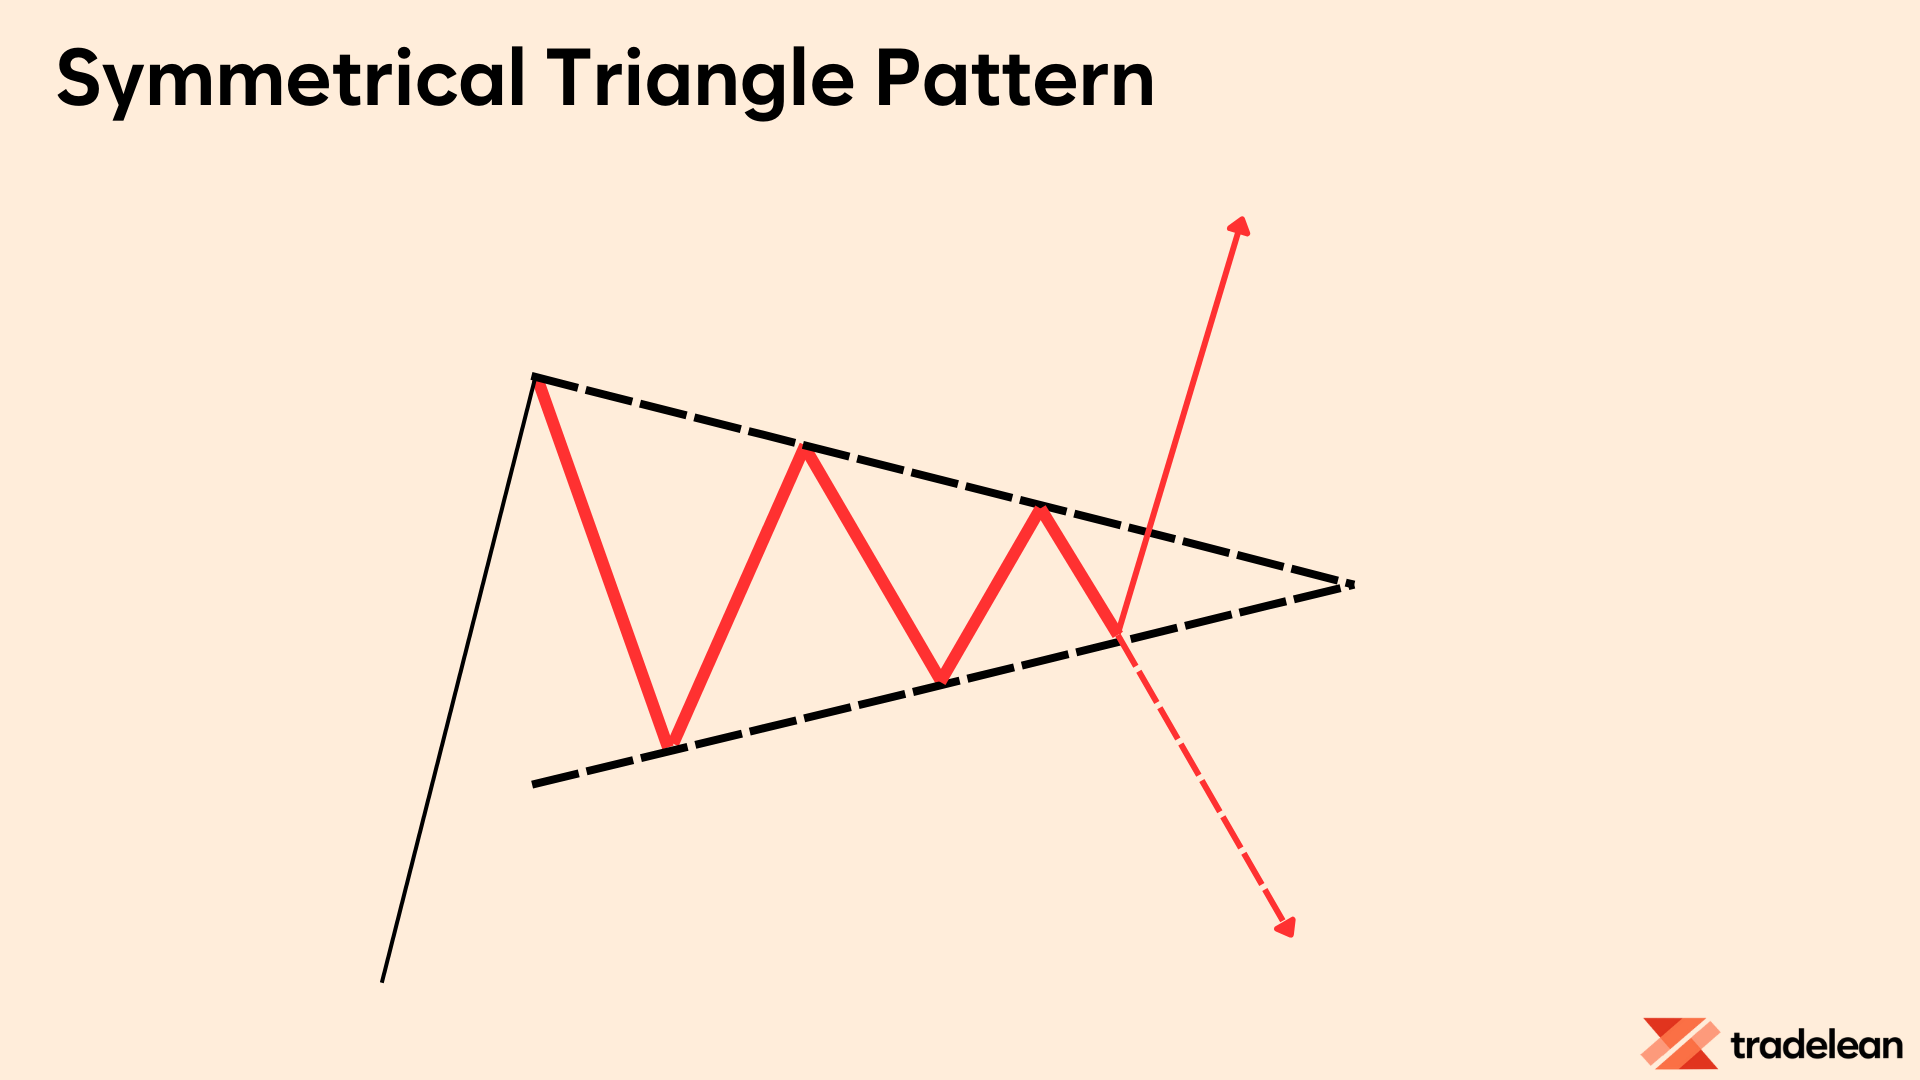
Symmetrical triangles reflect a market in a state of equilibrium, with neither buyers nor sellers in control.
The eventual breakout from the triangle often leads to a significant price movement in the direction of the breakout.
The Broadening Wedge Pattern
Broadening wedges expand with higher highs and lower lows, indicating increased volatility.
They can be continuation or reversal patterns.
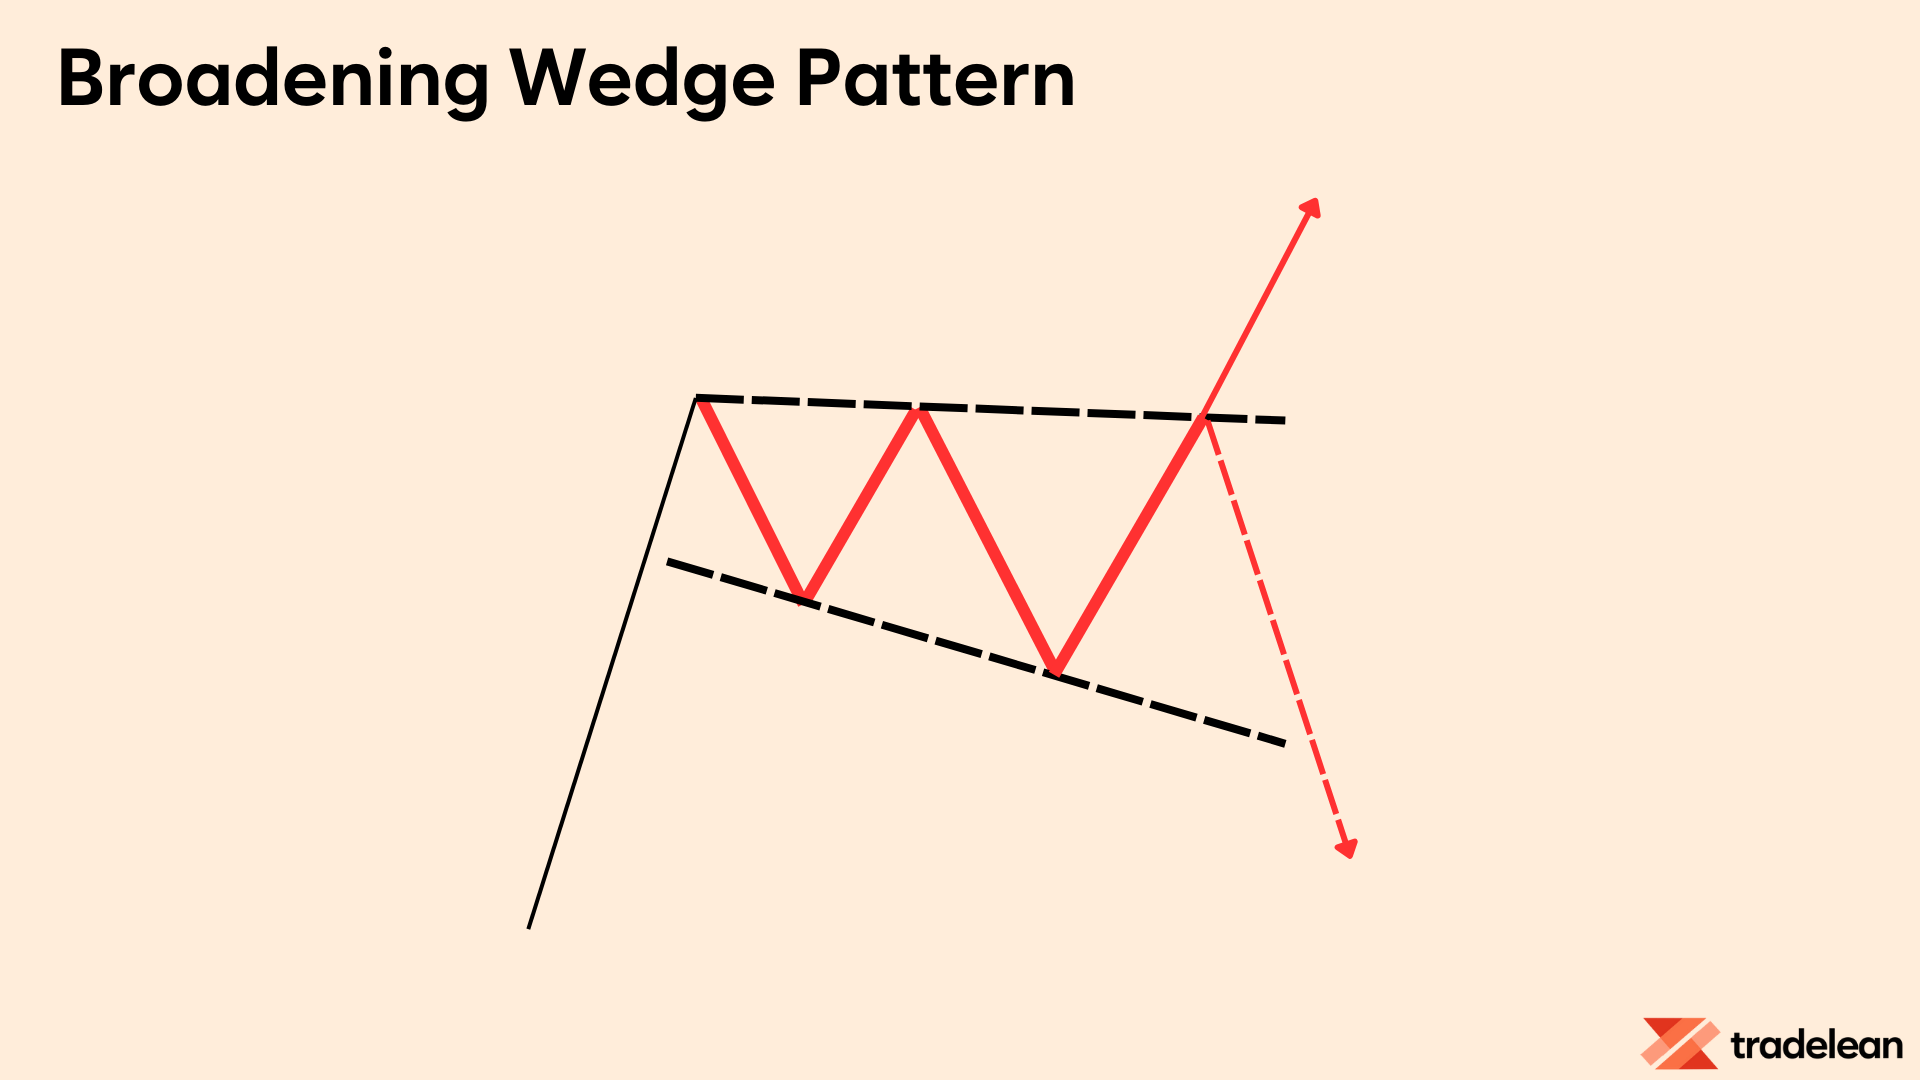
Broadening wedges are often seen in volatile markets and can be challenging to trade.
The breakout direction from these patterns can lead to significant price movements, making it essential to monitor the pattern closely.
Time-Consuming Nature of Chart Patterns
In the intricate dance of trading, patience is not just a virtue; it’s an essential skill that separates successful traders from the rest.
Patience in trading, especially when dealing with chart patterns, is about waiting for the right moment to act, understanding that good things come to those who wait.
This mindset is crucial because it takes time for chart patterns to form!
Chart patterns, by their very nature, take time to develop.
They are visual representations of market sentiment, reflecting the collective psychology of market participants.
Patterns such as the head and shoulders, double tops and bottoms, or the cup and handle do not form overnight, especially when are being developed in higher timeframes.
They require a series of price movements, often over days, weeks, or even months, to form.
Identifying chart patterns early in their formation is challenging.
At the initial stages, many patterns can look similar, leading to potential misinterpretation.
A forming Head and Shoulders Pattern might initially appear as a simple upward trend, only to reveal its true nature much later.
This is why patience is paramount.
Finally, remember!
Pattern is not a pattern until it breaks out!
Rushing to trade based on incomplete patterns can lead to entering a position too early, increasing the risk of a false breakout or a reversal.
Experienced traders understand that it's better to wait for confirmation than to act on anticipation.
For example, in the case of a falling wedge pattern, it’s crucial to wait until the price convincingly breaks out above the upper trend line before entering a trade.
Acting before this confirmation can lead to significant losses if the breakout fails.
Summary
Grasping chart patterns in trading is like learning a new language that unveils intricate details about market behavior and future price trends.
These patterns are essential tools that provide traders with insights to better understand market sentiment and make strategic decisions.
Recognizing formations such as the W pattern, head and shoulders, and wedges is vital for accurately predicting market reversals and continuations.
Patience is a critical trait for successful trading, especially when analyzing chart patterns.
These patterns develop over time, reflecting the psychological tendencies of market participants.
Making rushed decisions based on incomplete patterns can result in premature trades and potential financial losses.
Experienced traders understand the importance of waiting for complete patterns and clear confirmation signals before executing trades.
This disciplined approach minimizes the risks associated with false breakouts and sudden reversals.
In conclusion, chart patterns act as a roadmap in the complex landscape of trading.
They offer a structured method to interpret price actions and make informed decisions.
By combining technical analysis with patience and discipline, traders can navigate the markets more effectively, increasing their chances of success.
Continuous practice and thorough study are essential for developing the ability to interpret these patterns accurately, leading to better trading performance and achieving financial goals.
With dedication and ongoing learning, traders can enhance their skills, leading to more effective and profitable trading strategies.