Key Levels To Watch As Bitcoin is About to Enter Price Discovery
This post presents the technical analysis of BTCUSD pair conducted on November 6, 2024.

In this post, I'll analyze the BTCUSD based on its technical setup as of November 6, 2024, using the TradeLean Strategy.
The TradeLean philosophy focuses on simplicity and precision, avoiding cognitive overload.
If this sounds interesting to you, we always appreciate your support so please give this video thumbs up and subscribe to our Channel if you are new
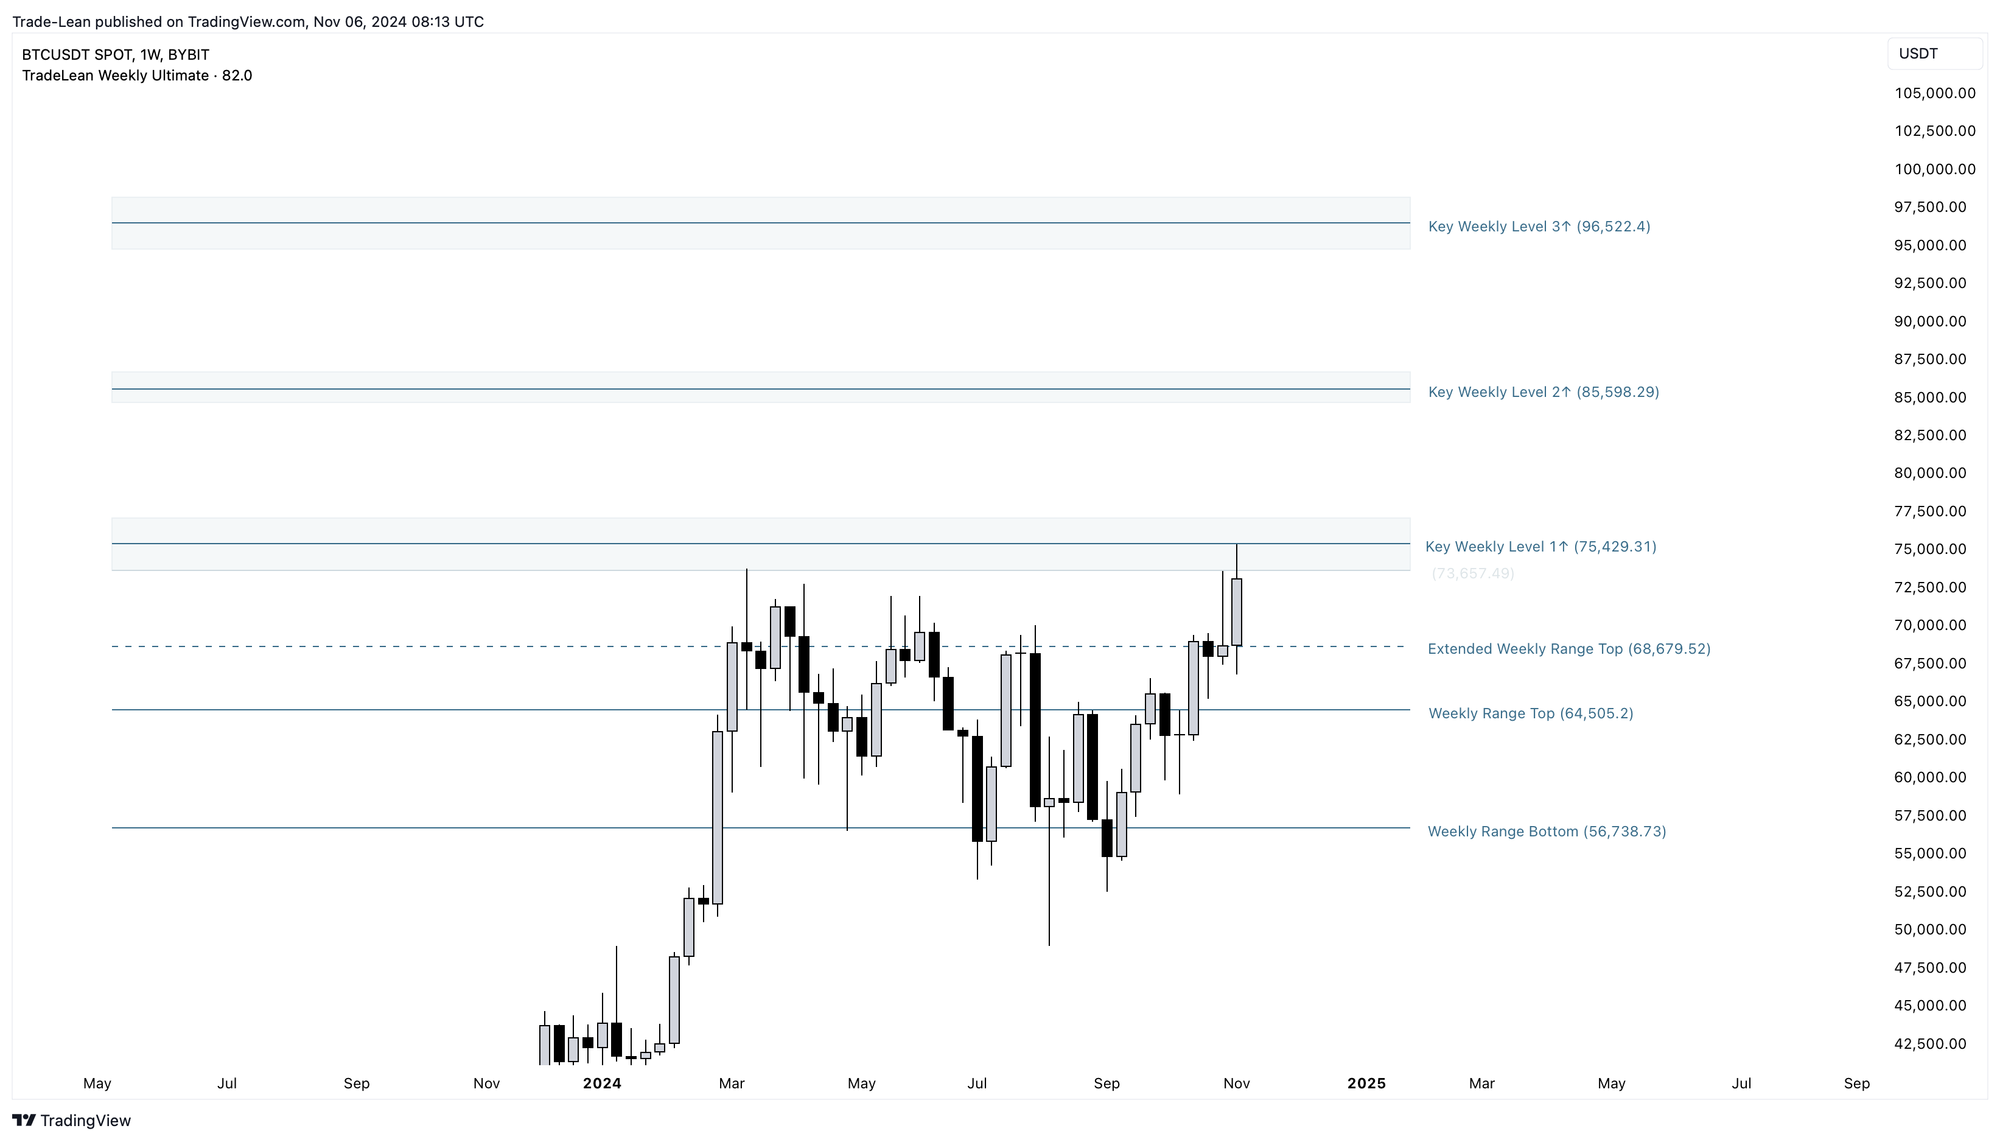
Weekly Chart

Bitcoin reached a new All-Time High today.
On the weekly chart, it tested the Key TradLean Level 1↑ at $75,429 with exact precision.
If Bitcoin moves above this key level, it will enter a price discovery phase.
Historically, Bitcoin tends to move aggressively in this phase once it breaks above its previous all-time high.
It’s important to monitor the zones around the Key TradeLean Levels, including:
- Key Weekly Level 2↑ at $85,598, and
- Key Weekly Level 3↑ at $96,522.
These levels will likely act as strong resistance, making price action with them essential to watch.
As long as Bitcoin trades above the Weekly Range Top at $64,505, it will continue to face upward bullish pressure.
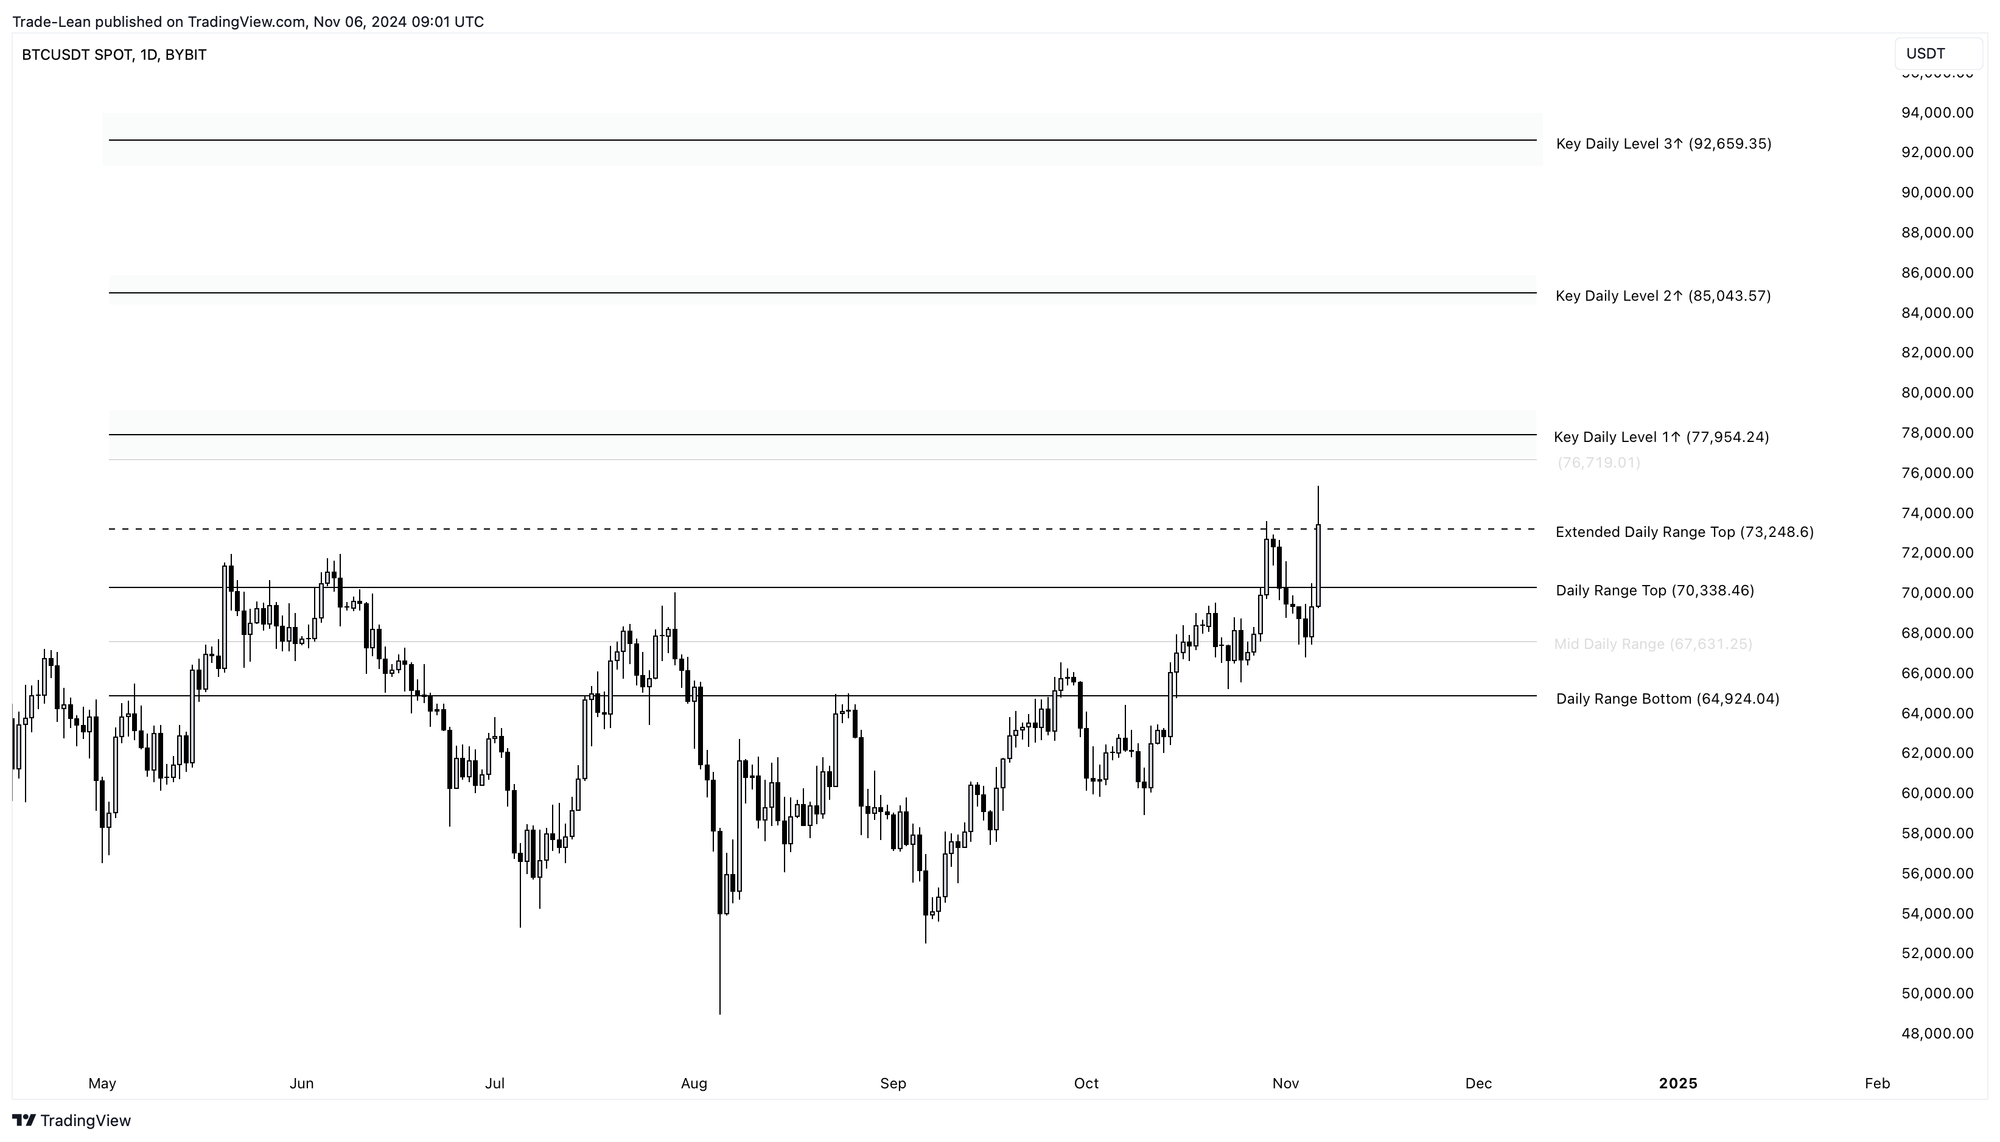
Daily Chart

On the daily chart, BTC/USD has broken out of its Daily Range Zone, driven by an increased chance of Trump winning the U.S. election.
The current daily candle appears strong and may continue moving toward the zone around Key Daily Level 1↑ at $77,954.
From a daily chart perspective, Bitcoin remains bullish as long as it stays above the Daily Range Top level of $70,338.
In the short to mid-term, it is likely to target the following price levels:
- Key Daily Level 1↑ at $77,954
- Key Daily Level 2↑ at $85,044
- Key Daily Level 2↑ at $92,659
However, if Bitcoin cannot maintain its position above the Daily Range Top at $70,338, momentum is likely to slow considerably.
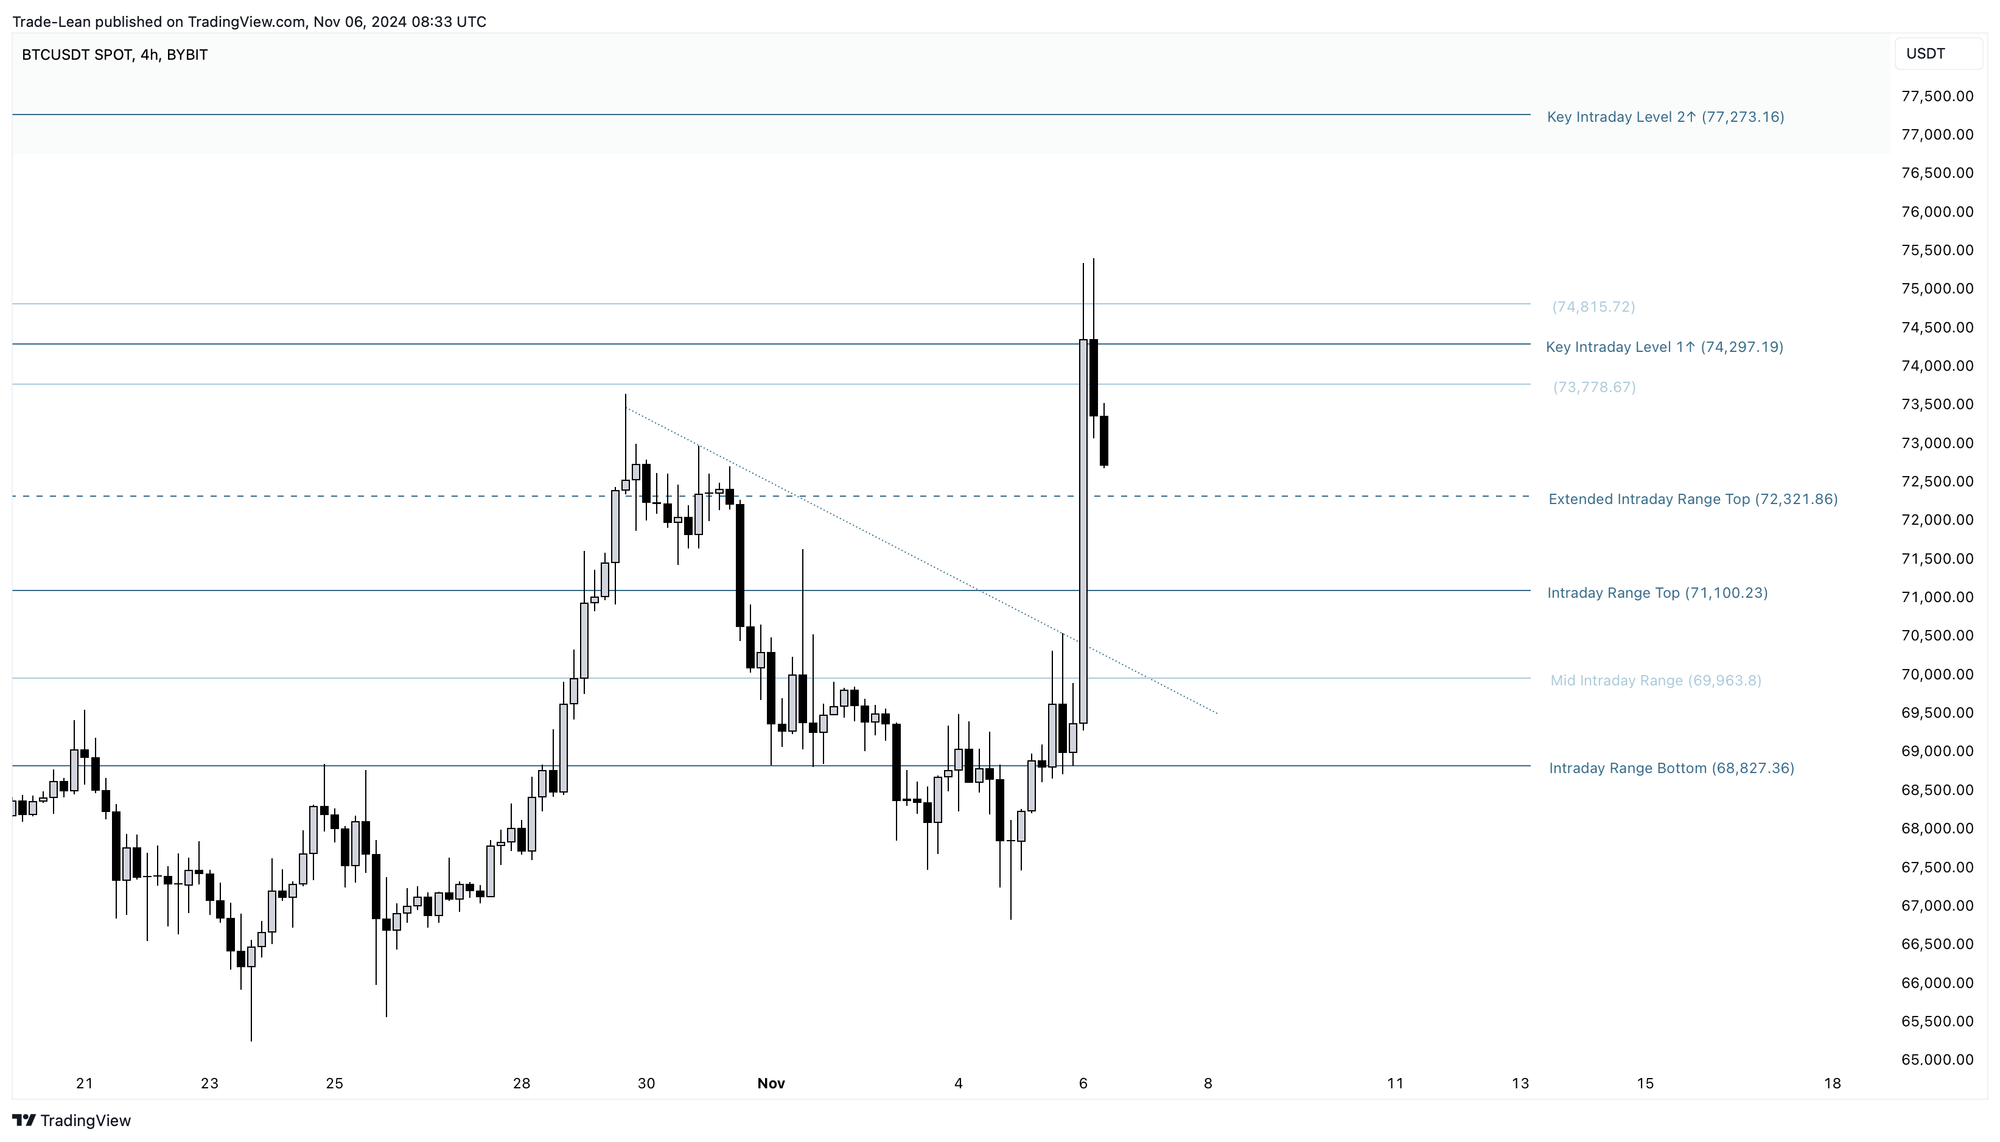
Intraday Chart

On the 4-hour chart, Bitcoin encountered resistance around $74,297, creating a price imbalance that might be addressed in the coming hours or days.
However, this correction isn't mandatory, and Bitcoin could continue its upward move, especially since it's trading near its previous all-time high.
A retest of the Extended Intraday Range Top or Intraday Range Top levels would be considered a healthy price action.
As long as Bitcoin remains above the Intraday Range Top at $71,100, the intraday outlook is bullish.
A breakout and sustained price action above $74,297 could propel the price toward the Key Intraday Level 2↑ at $77,273 and higher in line with daily and weekly target.
A bearish dip to $72,322 or $71,100, followed by a bullish rejection from either level, could present an opportunity for a long trade.