EURUSD Analysis: Will It Retrace to TradeLean POI?
This post presents the technical analysis of EURUSD pair conducted on November 5, 2024.
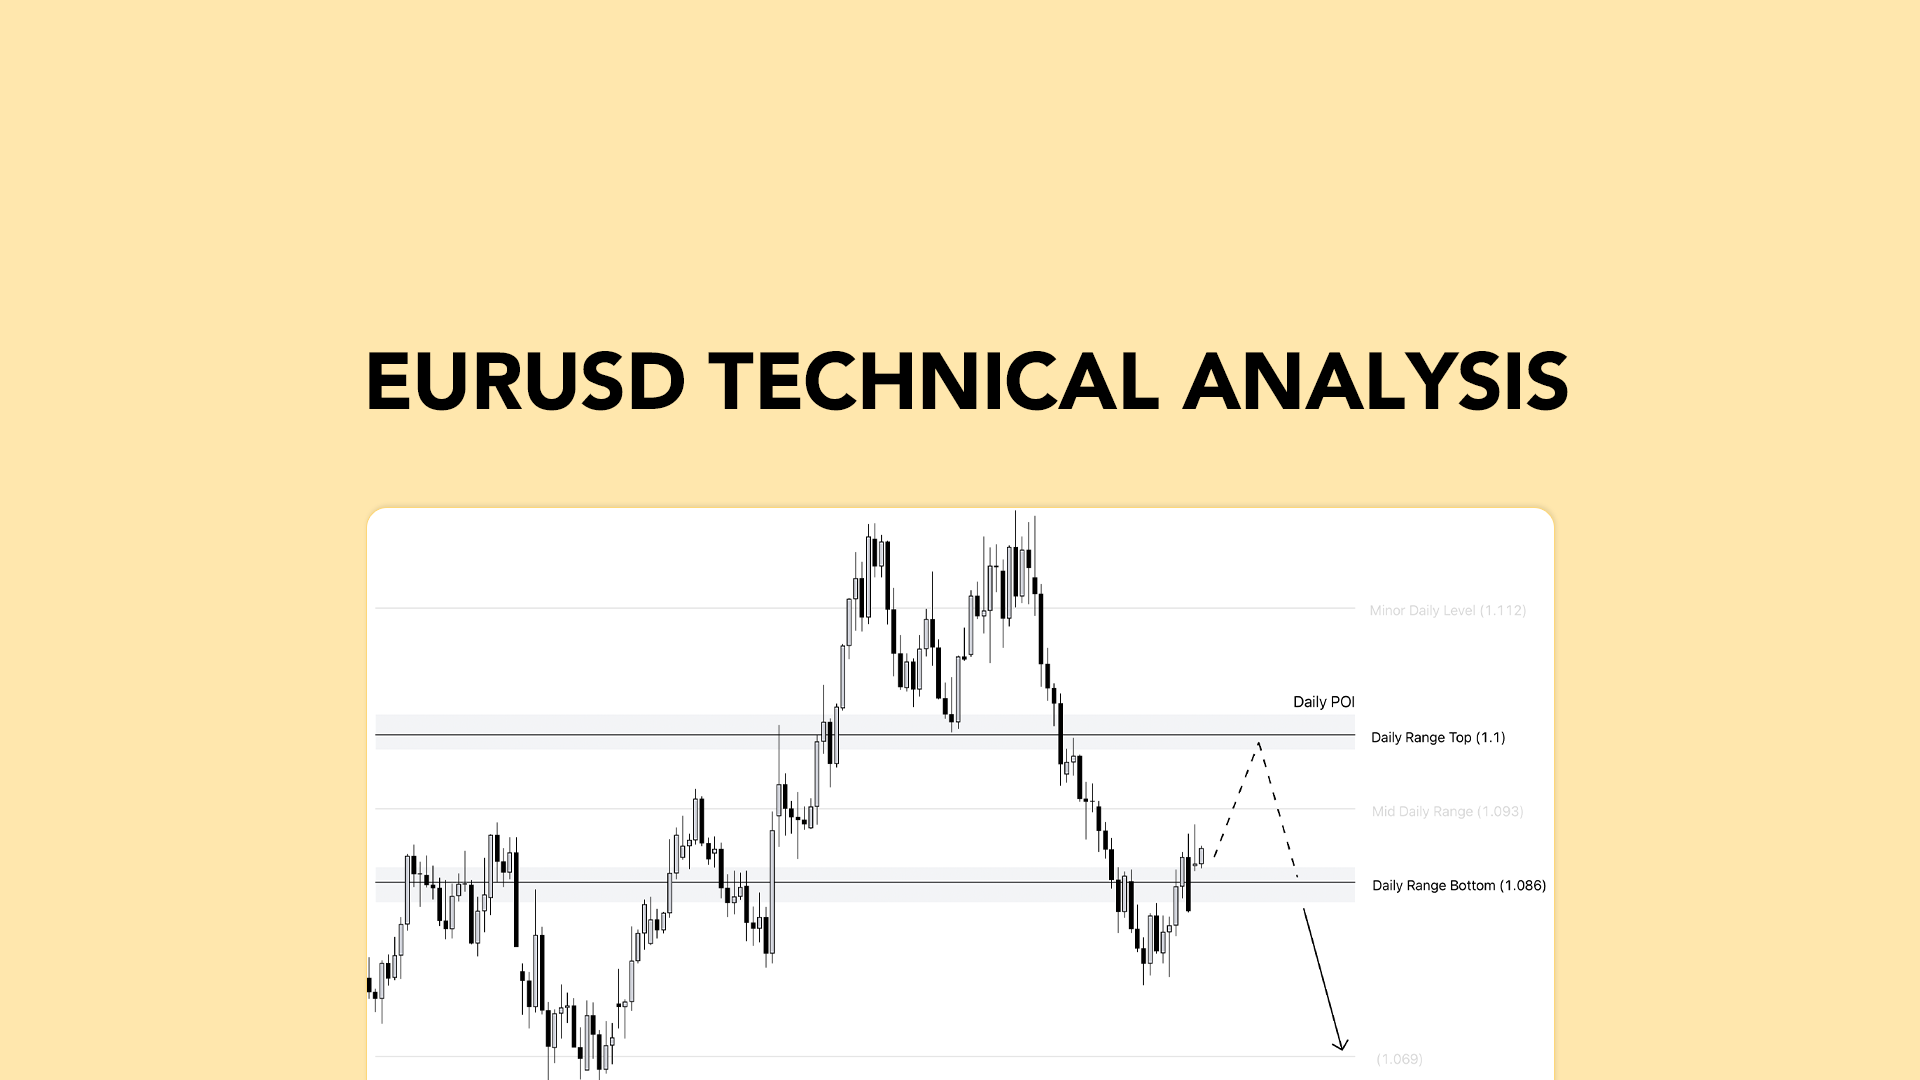
In this post, I'll analyze the EURUSD based on its technical setup as of November 5, 2024, using the TradeLean Strategy.
This approach focuses on market structure and price action with TradeLean proprietary price levels.
The TradeLean philosophy focuses on simplicity and precision, avoiding cognitive overload.
EURUSD Analysis: Will It Retrace to TradeLean POI?#eurusd #forex #trading #tradingforex https://t.co/9CYW07Z5xH
— TradeLean (@tradelean) November 5, 2024
Weekly Chart
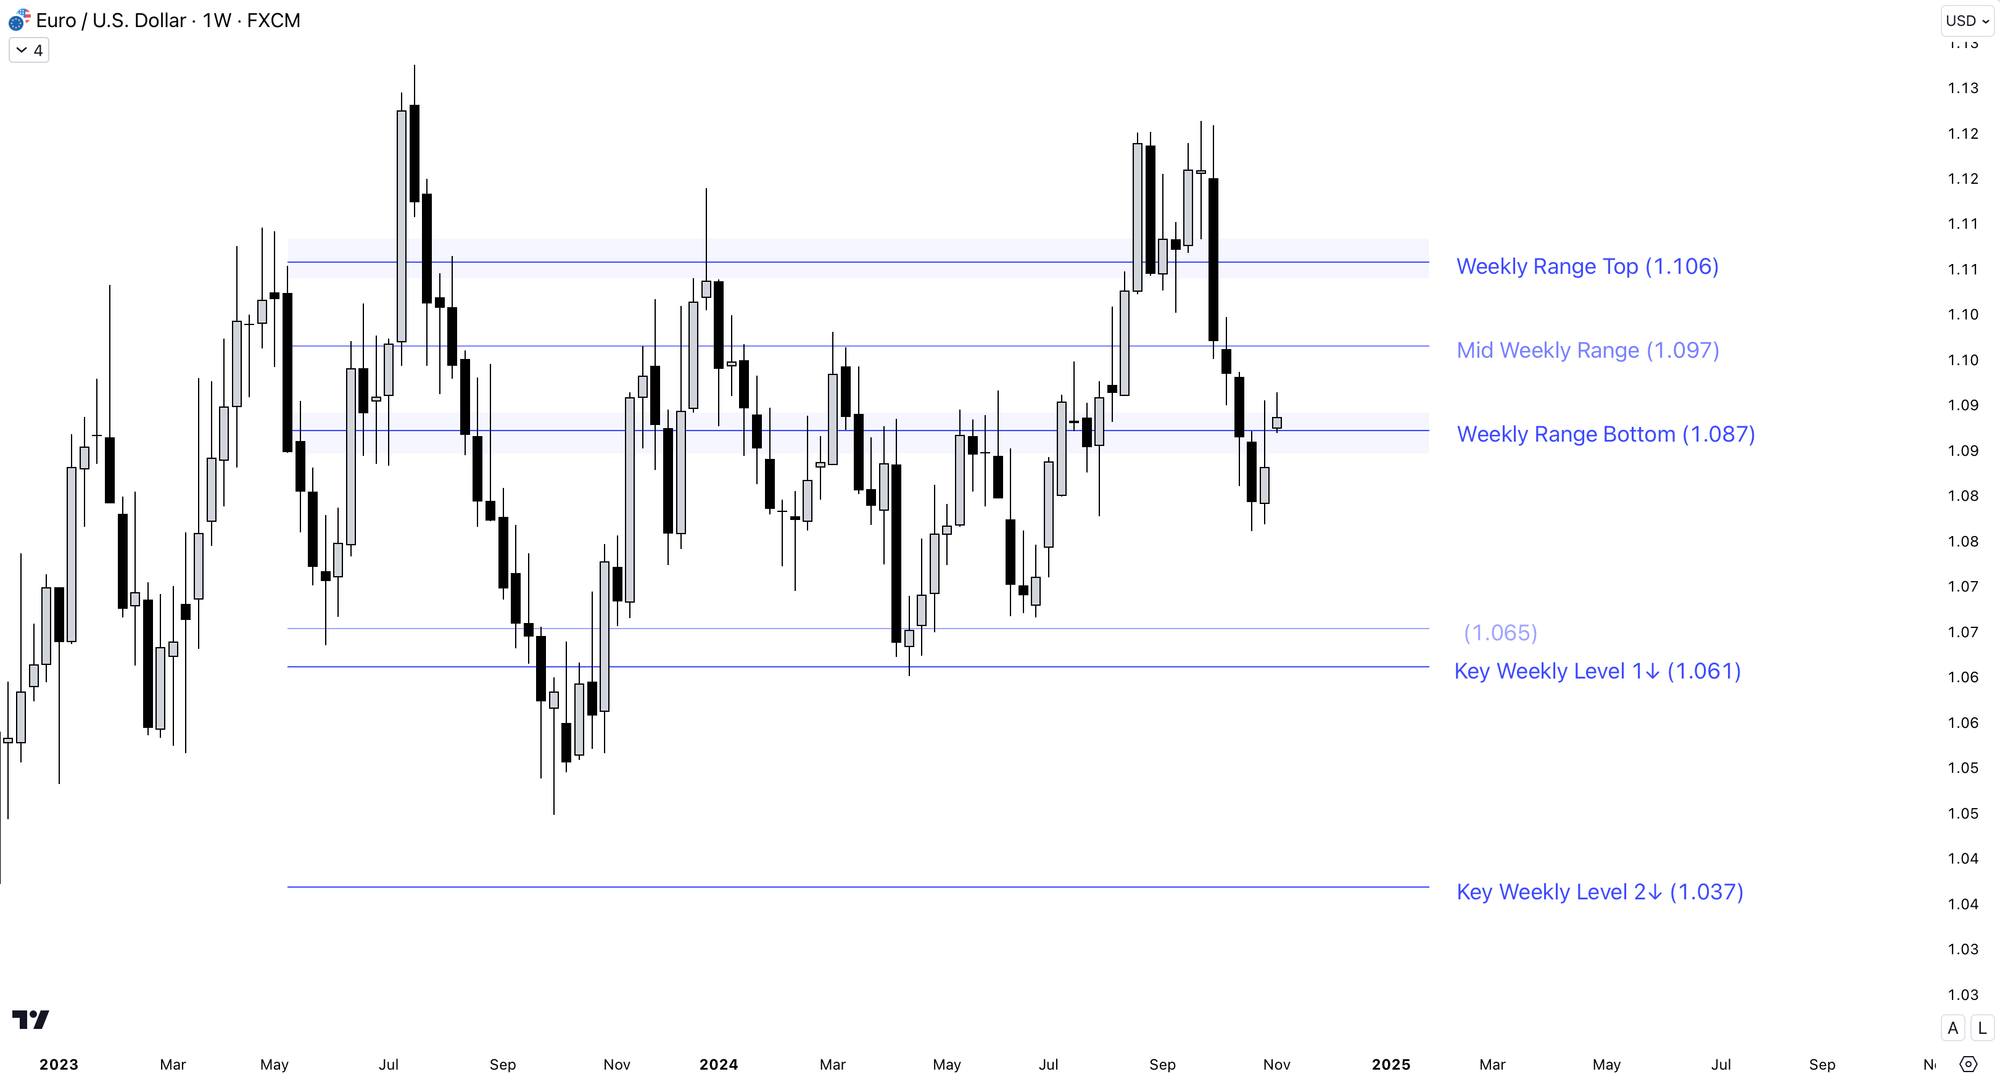
Since its impulsive move in 2022, EURUSD has been in a two-year consolidation phase.
In October, the pair dropped sharply, creating an inefficient move with a price imbalance.
Currently, the weekly candle has opened within the Weekly Range Zone, just above the Range Bottom at $1.087.

If EURUSD closes above this level by the end of the week, we could see a bullish retracement continue.
The price might rise to the Mid Weekly Range Level at $1.097, and potentially even reach the Range Top at $1.106.
This would help close the price gap left from October.
However, if EURUSD fails to hold above the Range Bottom at $1.087 and closes below it, the pair may enter a bearish zone, with the next target near Key Level 1↓ at $1.061.
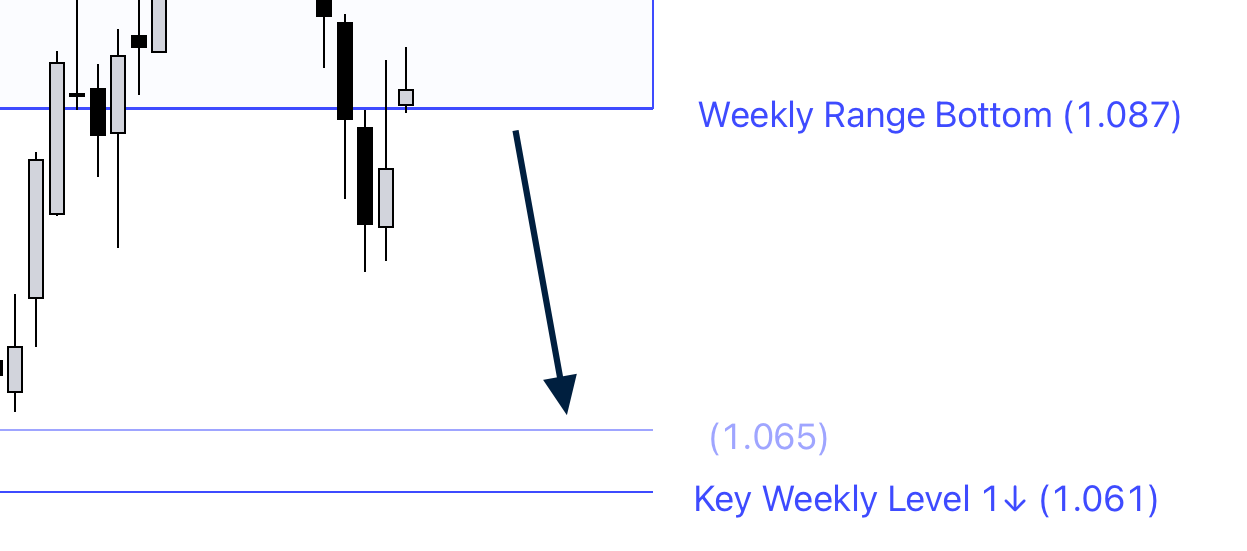
The end-of-week close will be significant, but for now, our focus will be on the daily and intraday charts.
Daily Chart
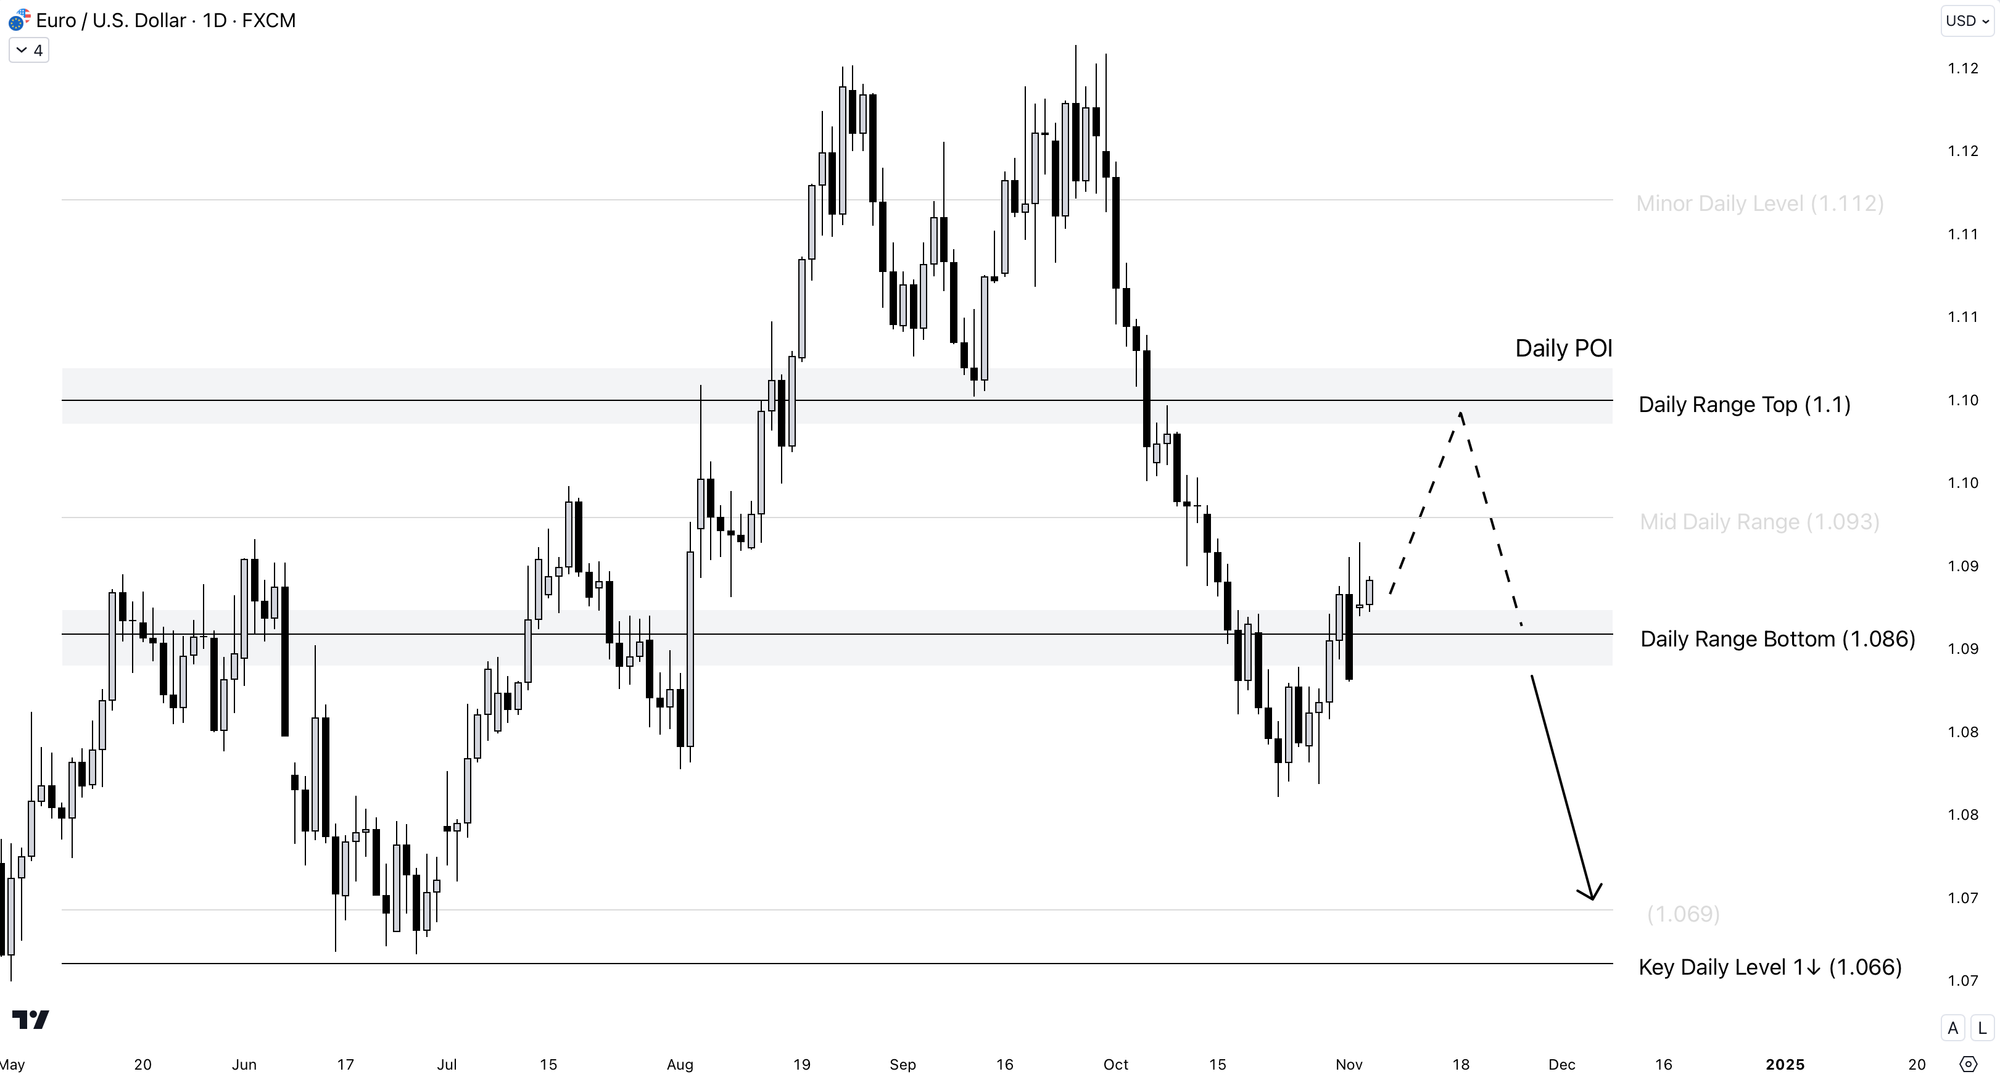
On the daily chart, EURUSD is trading within TradeLean Range Zone.
If another bullish candle closes above $1.086 (the Daily Range Bottom), it could push the price up to the Range Top at $1.1, which is our Daily Point of Interest (Daily POI).
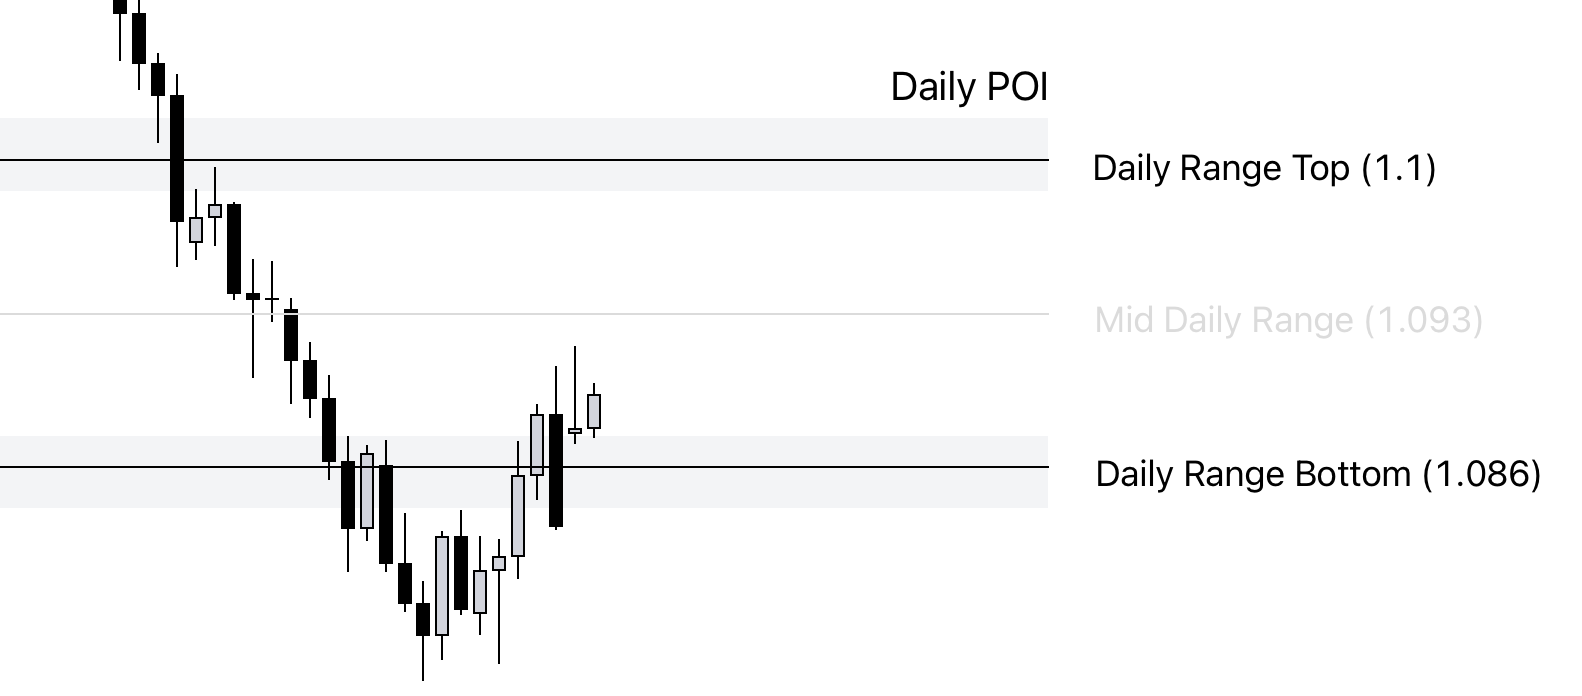
The Mid Daily Range may act as minor resistance on this move.
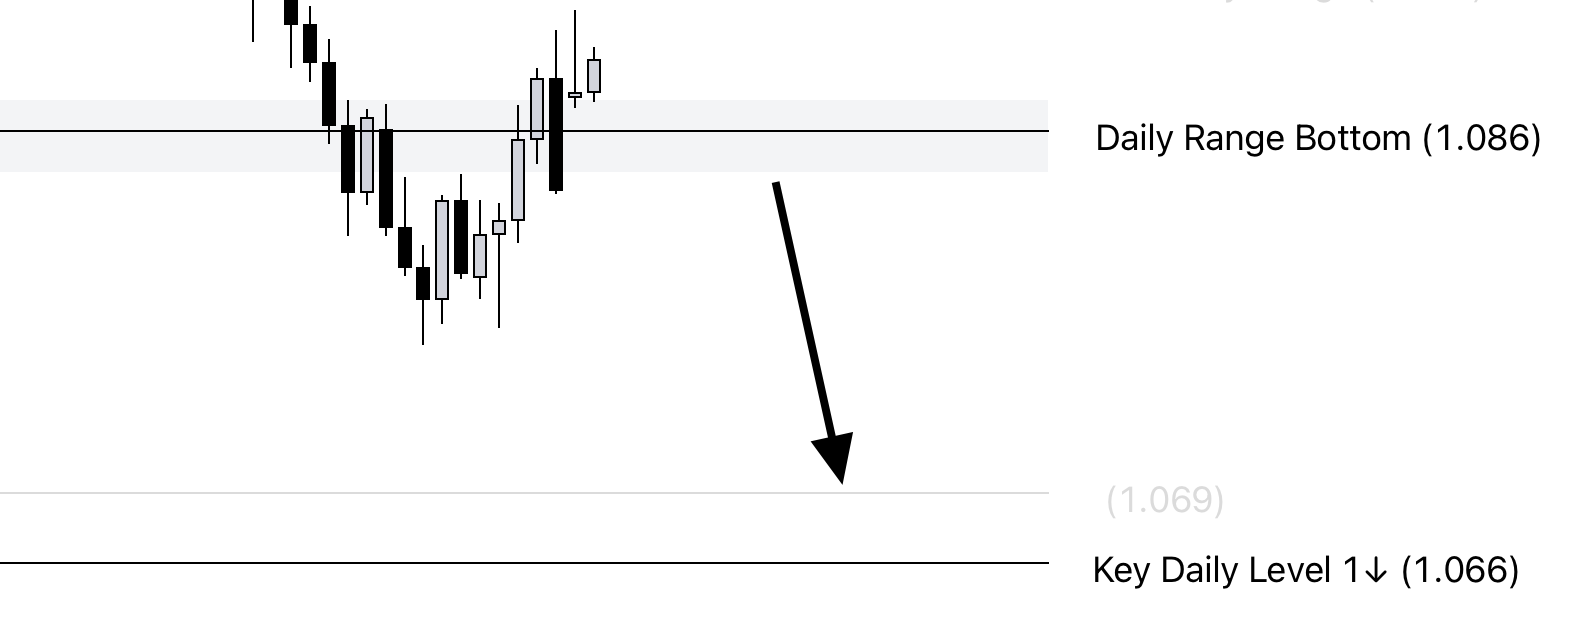
If EURUSD falls below the Daily Range Bottom, it enters a bearish zone, with the next target around Key Daily Level 1↓ at $1.066.
Alternatively, a bullish breakout above the Daily Range Top could extend gains to the Minor Daily Level at $1.112.
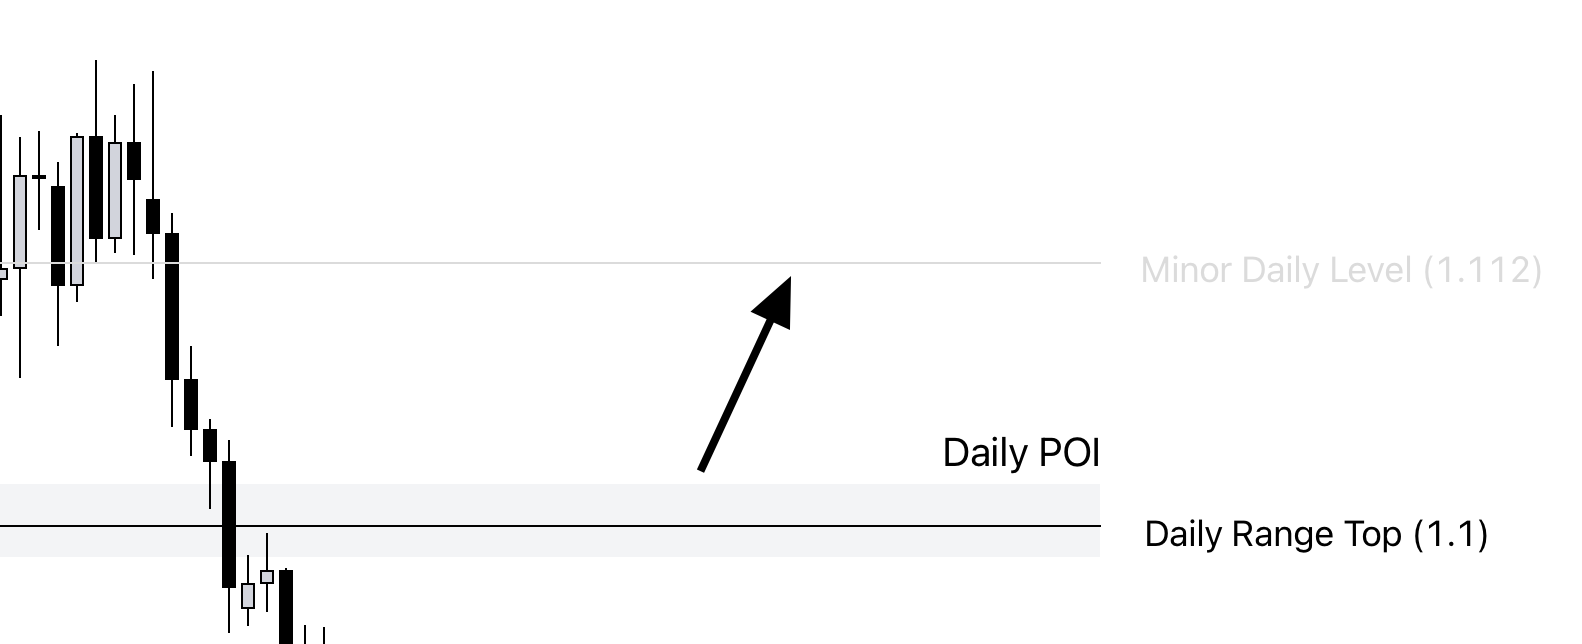
Though, this scenario is secondary as long as EURUSD remains within the Daily Range Zone.

Intraday Chart
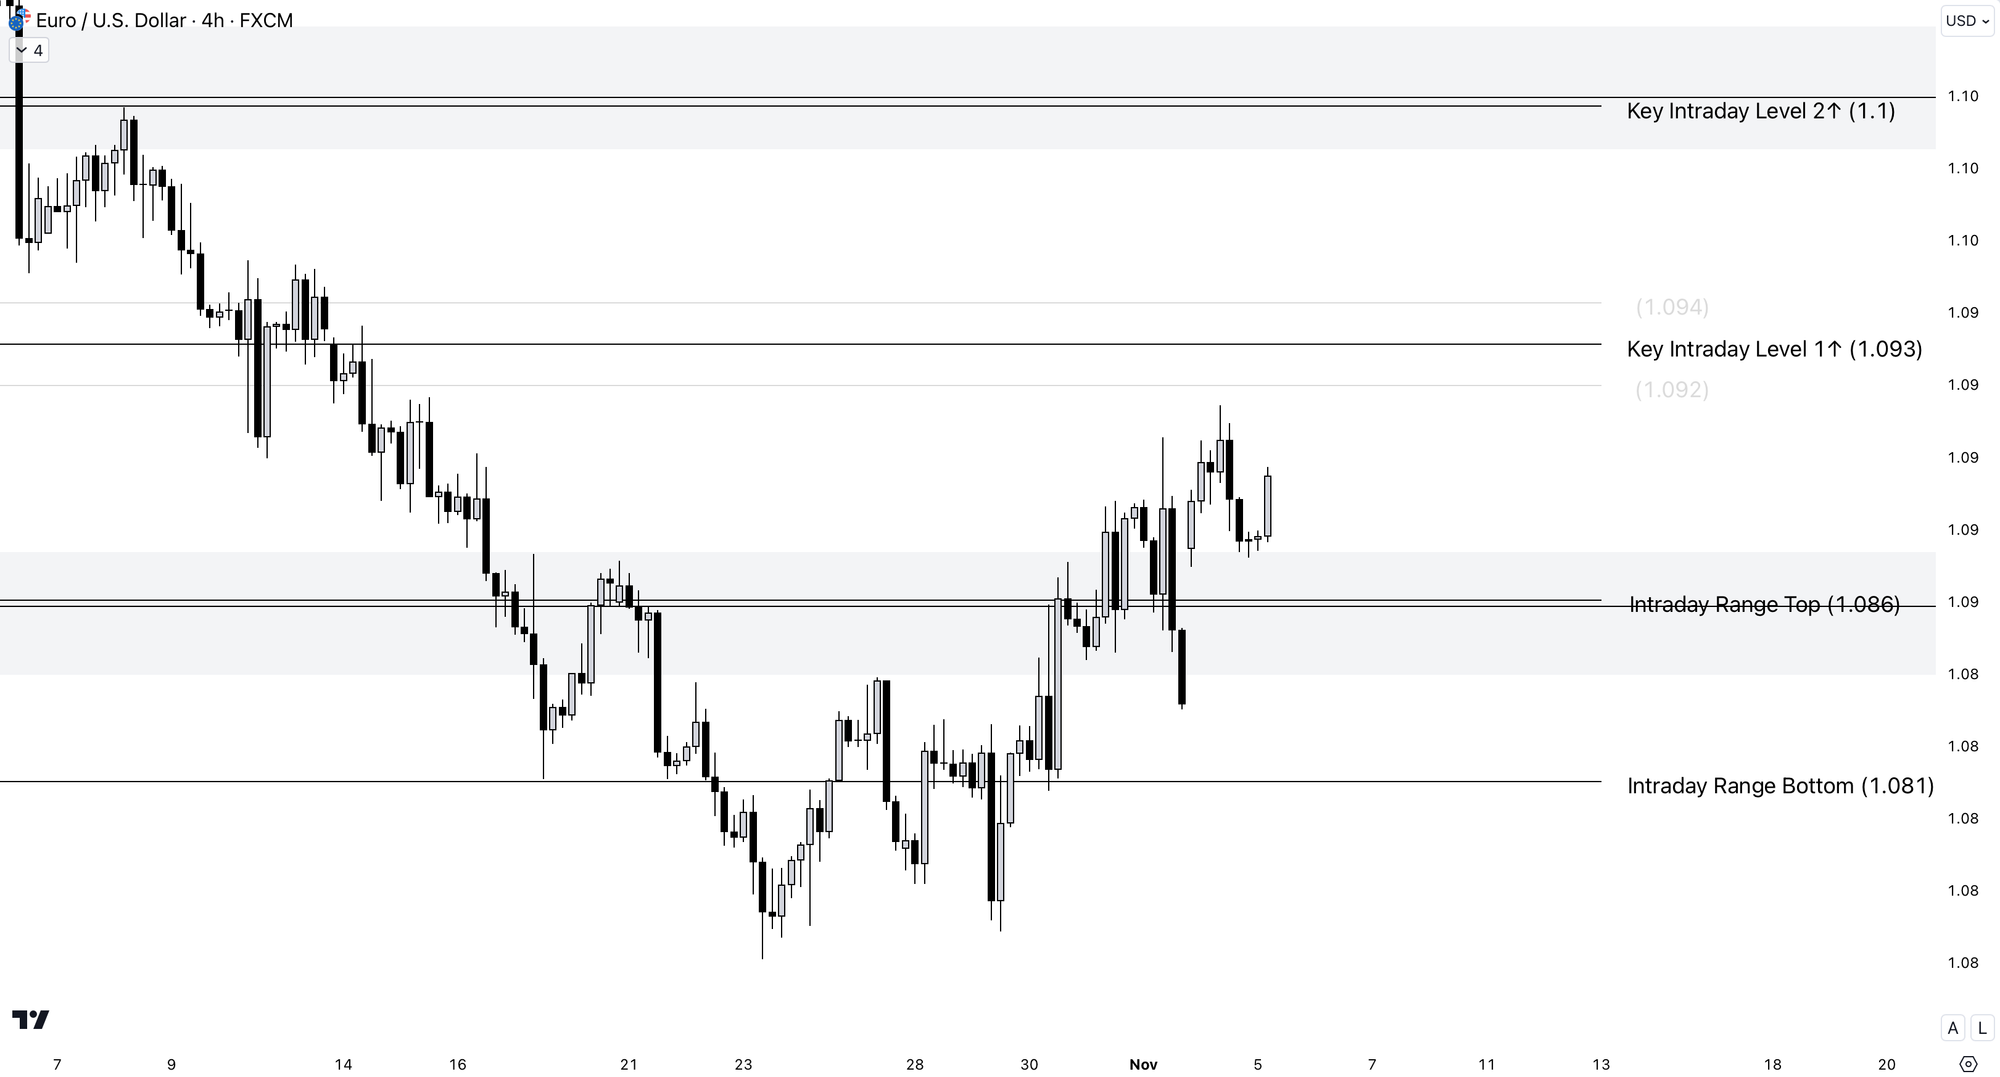
On the intraday chart, EURUSD has been trending bullish, forming higher highs and higher lows since late October.
It’s currently in bullish territory above the Intraday Range Zone.
Today, it tested and confirmed the Daily Range Bottom as support.
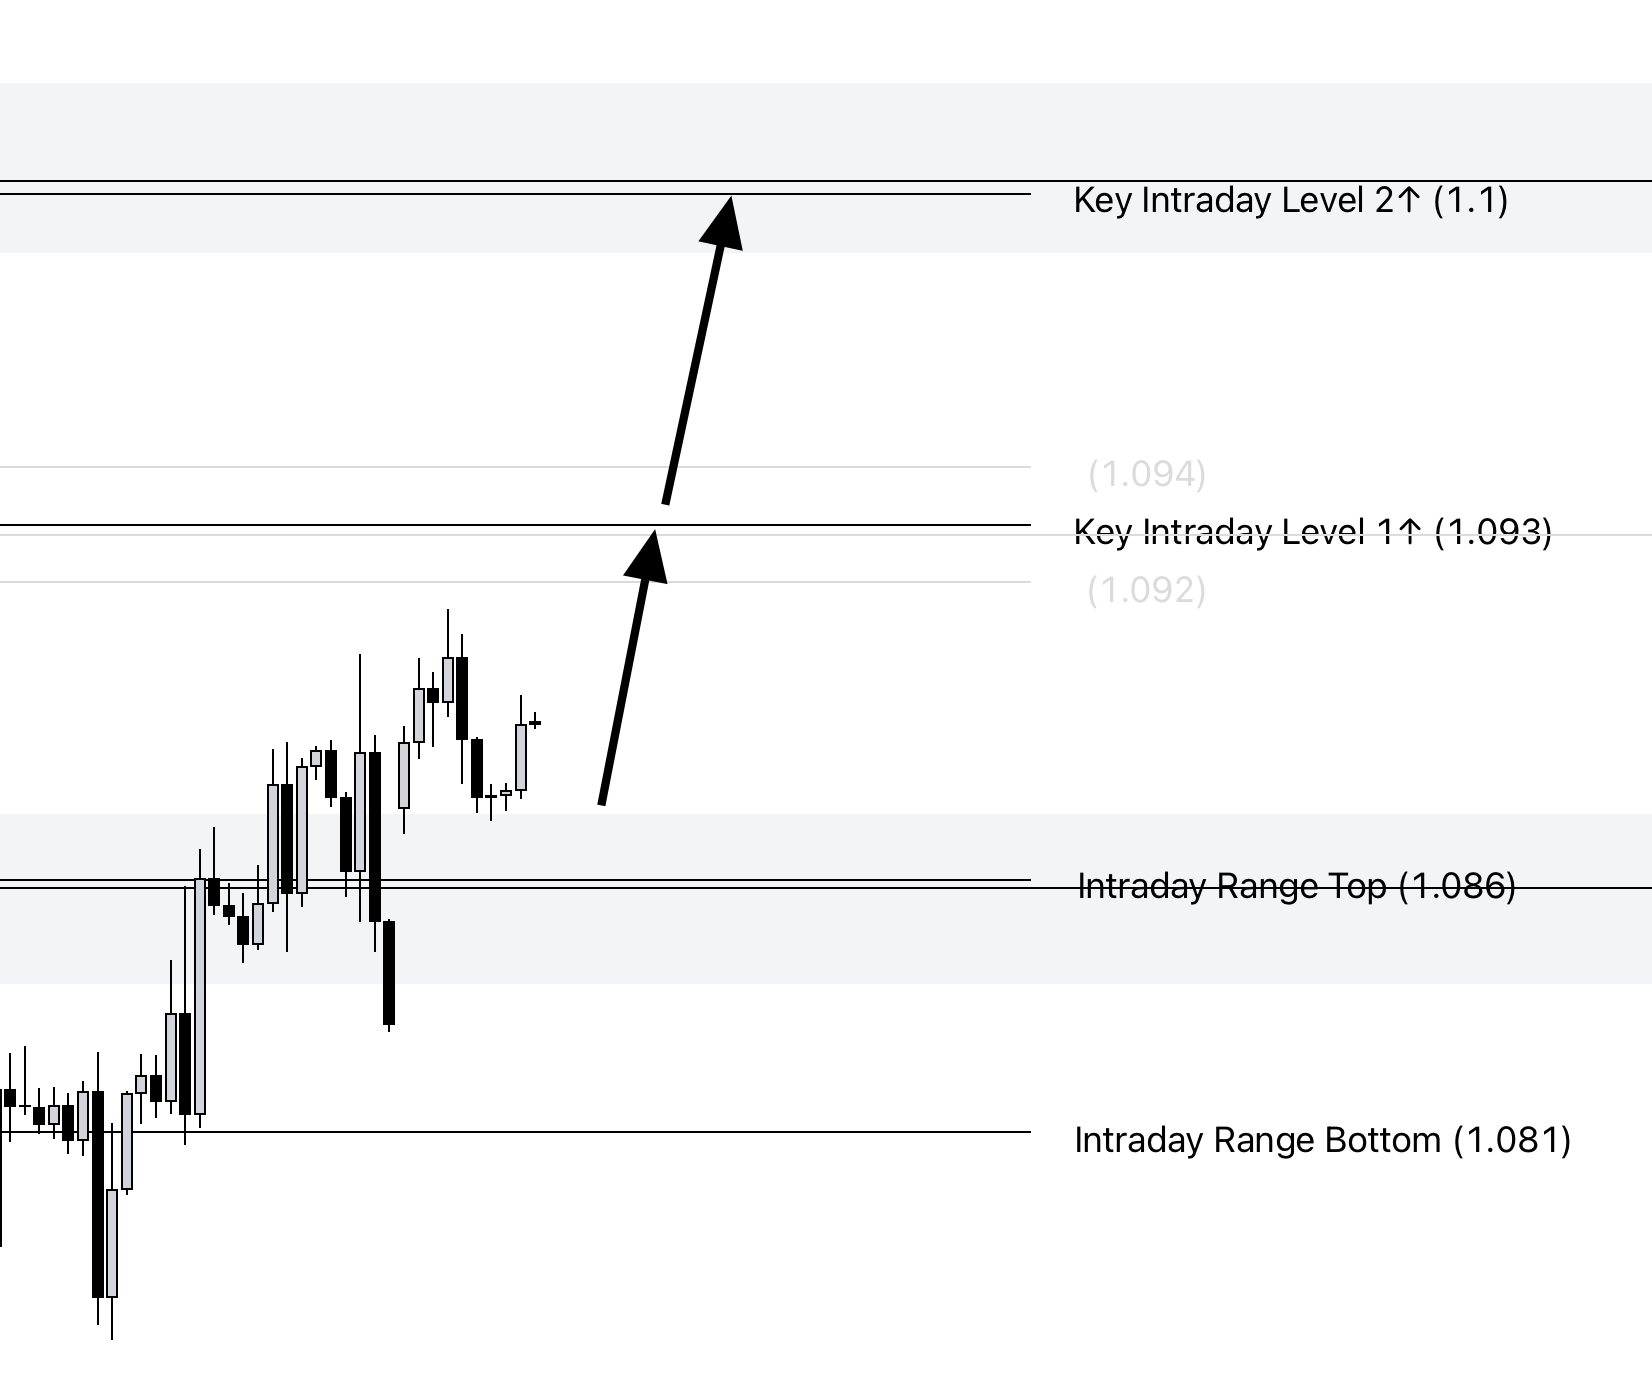
This short-term bullish momentum could push the pair toward Key Intraday Level 1↑ and further toward Key Intraday Level 2↑, aligning with our Daily POI.
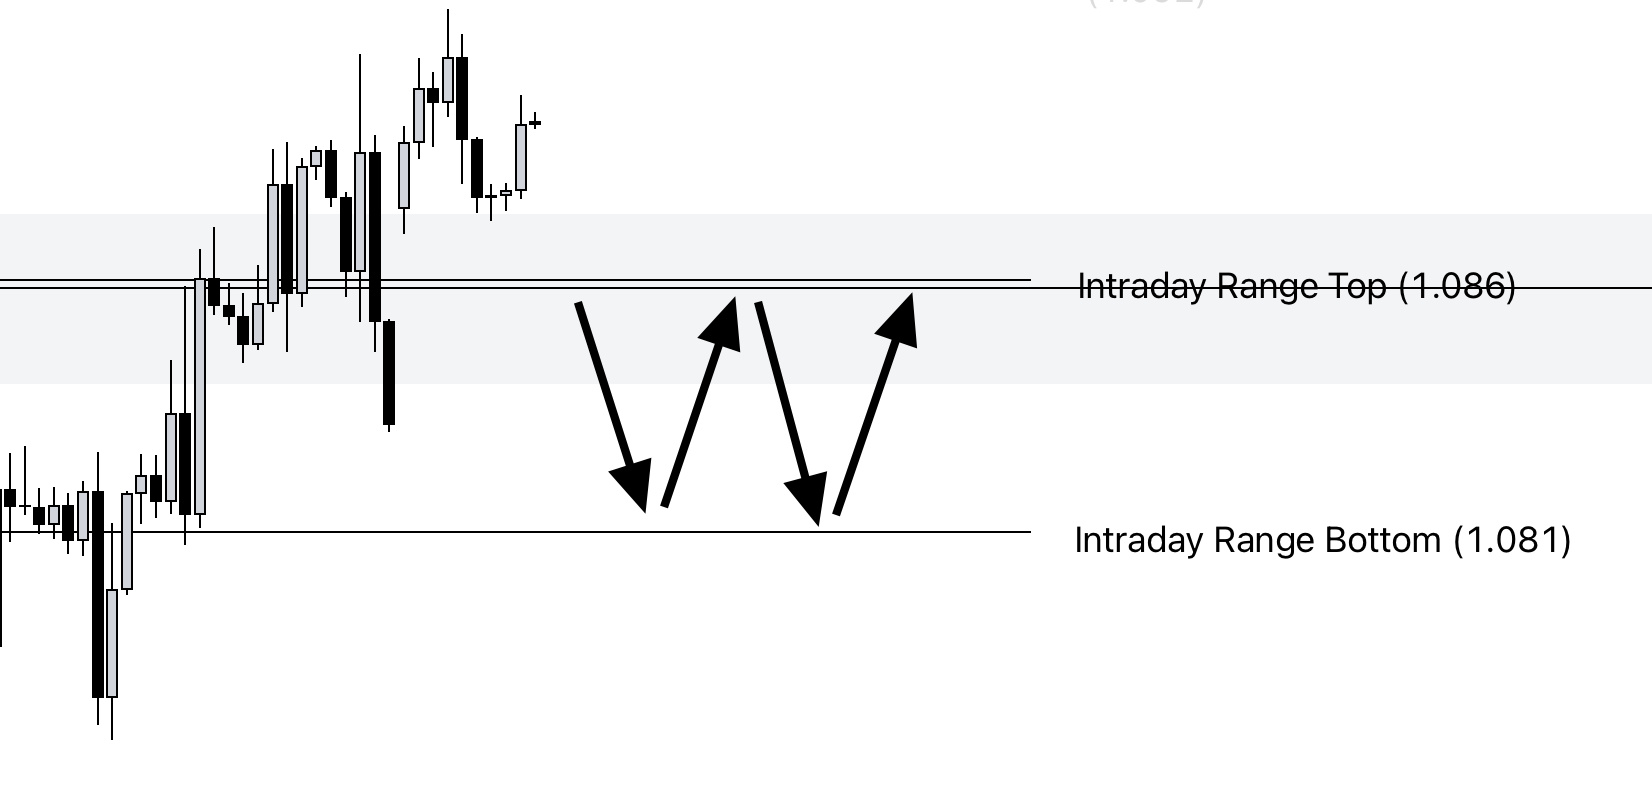
If EURUSD breaks below the Intraday Range Top, it may re-enter the Intraday Range Zone, leading to slower, choppier price action.
Trade Idea
The price action around the Daily POI is critical.
If EURUSD faces bearish rejection here on the intraday chart, it could present a short trade opportunity targeting Key Daily Level 1↓ at $1.061 and potentially lower.
I'll update with a specific trade setup once the price reaches the Daily POI.
